


Average daily TRACE volume for US investment grade (IG) and high yield (HY) corporates slipped 10.8% from April to US$52.8 billion, according to MarketAxess calculations, though activity still ran 22.3% ahead of May 2024. IG fell to US$39.7 billion (-11.2% month-on-month), while HY eased to US$13.2 billion (-9.6% MoM).
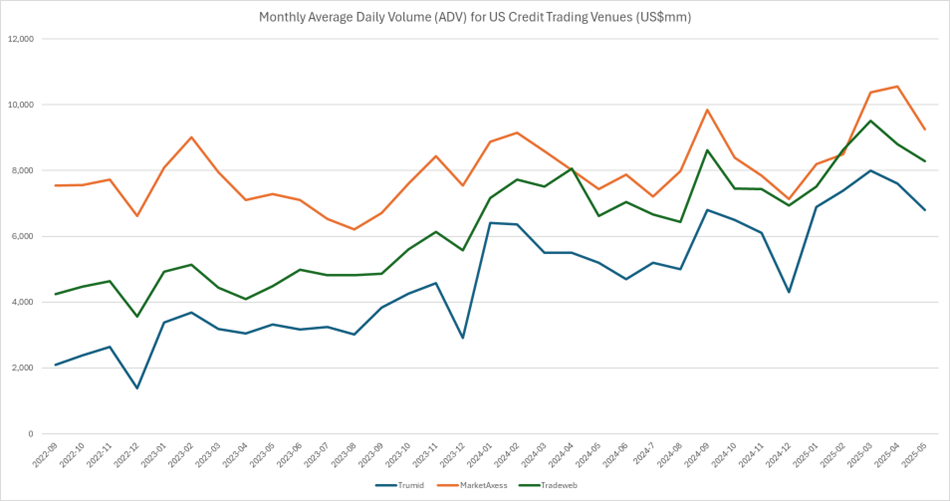
MarketAxess posted US$9.3 billion of credit average daily volumes (ADV), 12.4% lower than April but 24.3% above May 2024. Every cash product except eurobonds declined month-on-month (MoM). US IG ADV was US$7.65 billion, down 11% MoM but up 24.9% YoY, HY ADV was US$1.6 billion down 18.6% MoM but up 21.4% YoY, and emerging market credit ADV was US$3.62 billion.
Eurobonds set a fresh record at 2.9 US$ billion on a 500% jump in portfolio trading and a 116% surge in block volume. Dealer-initiated flow also accelerated, with ADV up 41% year-on-year (YoY) to US$1.8 billion.
Tradeweb’s fully electronic US credit ADV fell to US$8.3 billion, 6% below April but 25 % higher than in May 2024. Of that total, US$7.2 billion was investment-grade flow – down 4.1% MoM but up 23.7% YoY – and US$1.1 billion was in high-yield – dow, 17.1% MoM but up 34.2% YoY . European cash-credit ADV eased to about US$2.4 billion (-11.6% per cent MoM, but +8.6 per cent YoY). Credit-derivative activity was down 42.4% to US$17.01 billion from April’s US$29.6 billion, though it remained 95 per cent above the prior-year level, while repo ADV set a fresh high to US$780 billion ADV.
Private venue Trumid recorded US$6.8 billion ADV, 10.5% below April’s peak yet 30.8% up YoY. It said its Request for Quote (RFQ) activity was strong with protocol ADV and trade count both more than doubling YoY, supported by an 81% AutoPilot ‘no-touch’ rate. According to Trumid, buy-side engagement hit a new high: asset manager ADV rose approximately 60% YoY, and roughly 70% more buy-side traders traded on the platform daily than a year ago. The platform does not break out IG versus HY, limiting direct comparisons with its listed rivals.
©Markets Media Europe 2025


 more valuable")


