


Dealers are holding positive levels of longer-dated corporate bonds in their inventories again, and treasury bills drove volume growth in H1 2023, according to the latest research by market analyst firm, Coalition Greenwich.
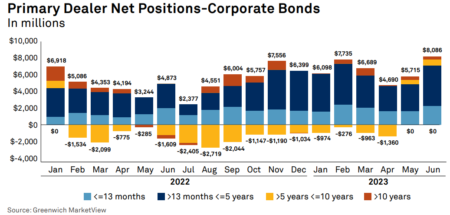
Primary dealer net positions in June hit their highest level (US$8 billion) since November of 2021, up from US$5.7 billion in May. Dealer holdings of five-to-ten year and > ten-year bonds, moved into positive territory for the first two consecutive months during May and June in a 15-month period, according to report author Kevin McPartland, head of research for Market Structure & Technology at Coalition Greenwich.
New issuance of bonds was up 39% in June compared to June of last year and dealer holdings suggest that some of the new issue activity is staying on bank balance sheets.  “Assuming corporate bond markets will remain calm in the summer months likely isn’t the best bet, given continued interest rate uncertainty and a recession that is supposed to come but hasn’t yet,” McPartland wrote. “And while the mini bank crisis of March seems to be over, it’s hard to forget that the Bear Stearns collapse in March 2008 was not the end of that crisis. This doesn’t really look or feel like that, but there is no such thing as a sure thing.”
Corporate bond trading in June was largely on par with June 2022 – US$36 billion traded per day on average. The average daily trade count remains above 100,000 since October 2022, with April the only exception (96,701). This put the average trade size in June at US$378,117. While electronic trading of investment grade bonds grew slightly to 43% from 41%, e-trading in high yield stayed mostly flat. In US rates trading volatility, measured by the ICE BofAML MOVE Index, decreased in June 2023 compared to June 2022, down 8%.
Comparing H1 2023 to H1 2022, the average daily notional volume traded was up 11%, at US$751 billion per day. Most of the volume growth came from the T-bills market, which saw its ADNV jump 48% year over year. Primary dealer net Treasury positions as of month-end June 2023 doubled – 101% growth – from June 2022. Market share in electronic trading of Treasuries has seen the once dominant Brokertec platform, owned by CME, tumble compared with it rivals. Tradeweb and Bloomberg’s share both grew in the first half of 2023 by four percentage points to 26% each. 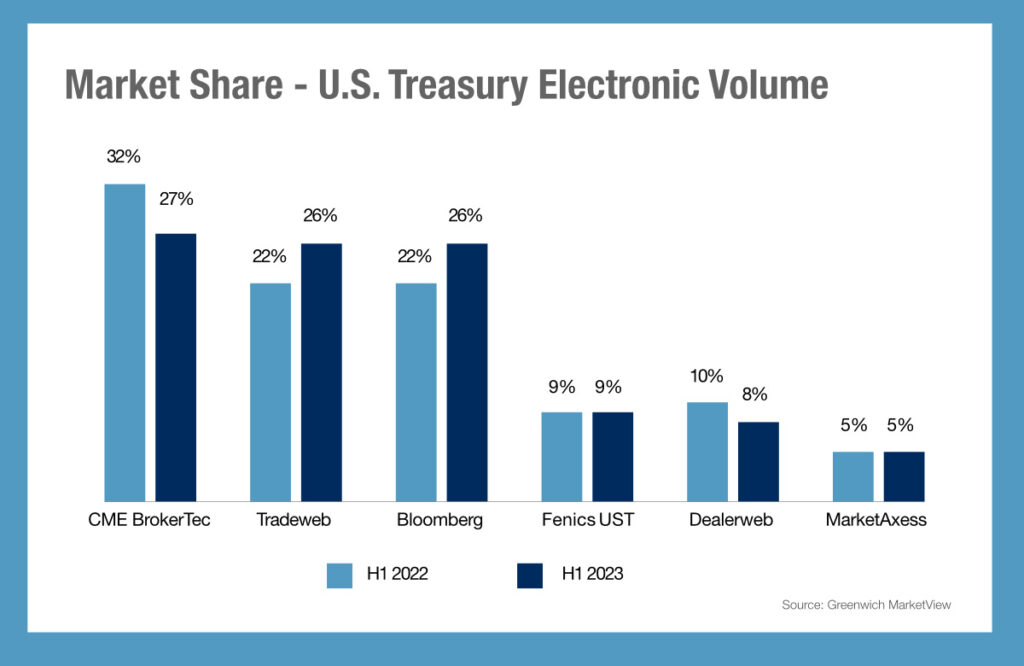 CME BrokerTec’s market share fell five percentage points between H1 2022 and H1 2023, from 32% down to 27%. For context, in 2017 Brokertec was estimated by analyst firm Celent to have a 77% market share for interdealer trading, with Nasdaq’s eSpeed (now part of Tradeweb) at 15% and Tradeweb’s Dealerweb tool at 2%.
Electronic trading in H1 2023 was similar to H1 2022, with 64% of notional volume traded electronically compared to H1 2022’s 66%. That slight decline came from reduced activity between dealers, with the buy side trending in the opposite direction, Coalition Greenwich reported. The buy side’s increased use of auto-execution tools helped drive up volumes on Bloomberg and Tradeweb in particular, whereas dealers have increasingly looked to internationalisation and the derivatives markets to hedge, reducing their reliance on central limit order book (CLOB) markets.
©Markets Media Europe 2023

©Markets Media Europe 2025


 more valuable")


