


Jonathan Rick
Director of Research, Tradeweb
The European Union’s stepped-up role as a central funding source for member states as they recover from the coronavirus pandemic positions it in a unique spot among supranational borrowers. Issuance of Support to mitigate Unemployment Risks in an Emergency (SURE) bonds over the past year and a further €800bn of potential new debt have transformed the borrower into a market bellwether, with liquidity and other market metrics commensurate with other leading European government and supranational names.
As it further standardizes its approach to funding – announcing earlier this month a strategy to issue around €150bn per year of bills, bonds and notes through 2026 as part of its Next Generation EU program – it will likely continue to bridge the gap between a typical supranational issuer and a government issuer of the confederation, with liquid securities across the yield curve. This change in market perception certainly seems to be happening quickly as investors support the EU’s long-awaited emergence as a large, regular issuer in the European bond market.
In both yield and turnover rates, EU debt is already behaving much like some of Europe’s highest-rated and liquid supranational, sub-sovereign and agency (SSA) names.
Moreover, in terms of bid/ask spreads, there has been a marked improvement since last summer for EU bonds, particularly since it began issuing SURE bonds in October and into this year. After being noticeably wider than other government bond and SSA issuers, the bid/ask spread has largely tightened to levels in-line with other issuers.
FIGURE 1
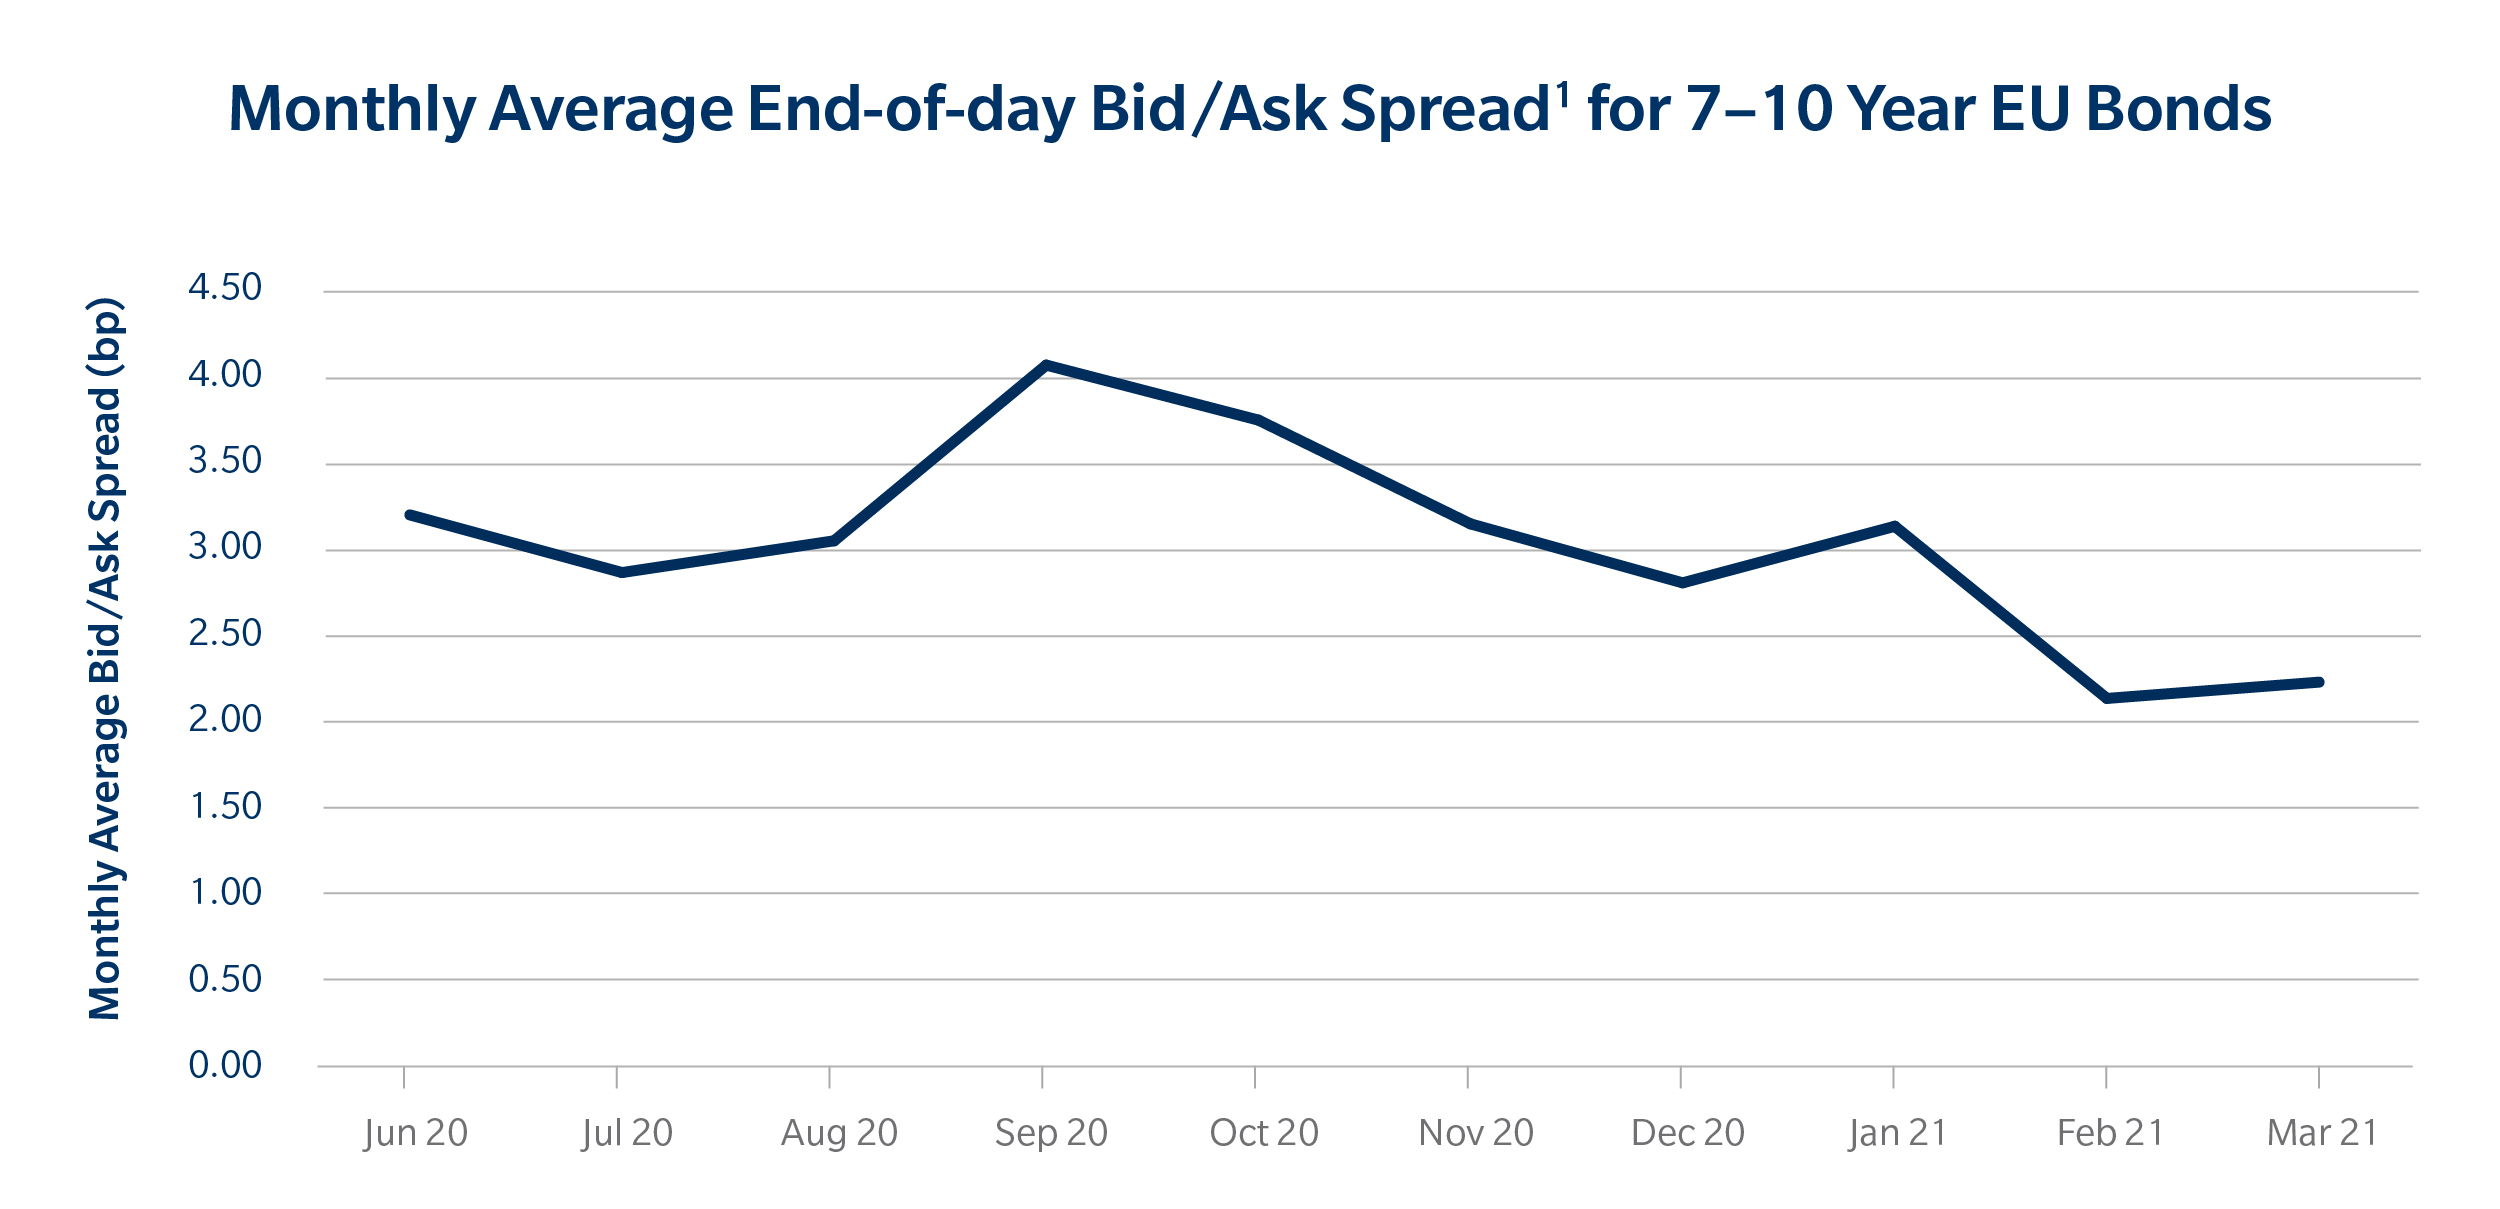
Source: Tradeweb
On yield, it is performing in line with traditional highly rated issuers like the European Investment Bank (EIB) and Austria. Relative to German development bank KfW, another top-rated borrower, the yield on the EU’s 5-year bonds are 2bp below it, suggesting that investors are valuing EU bonds more attractively.
As a reference, EU bonds traded noticeably cheap in the five-year sector last summer to all three of these issuers – 11bp cheap, in fact, to KfW (see Figure 4).
FIGURE 2
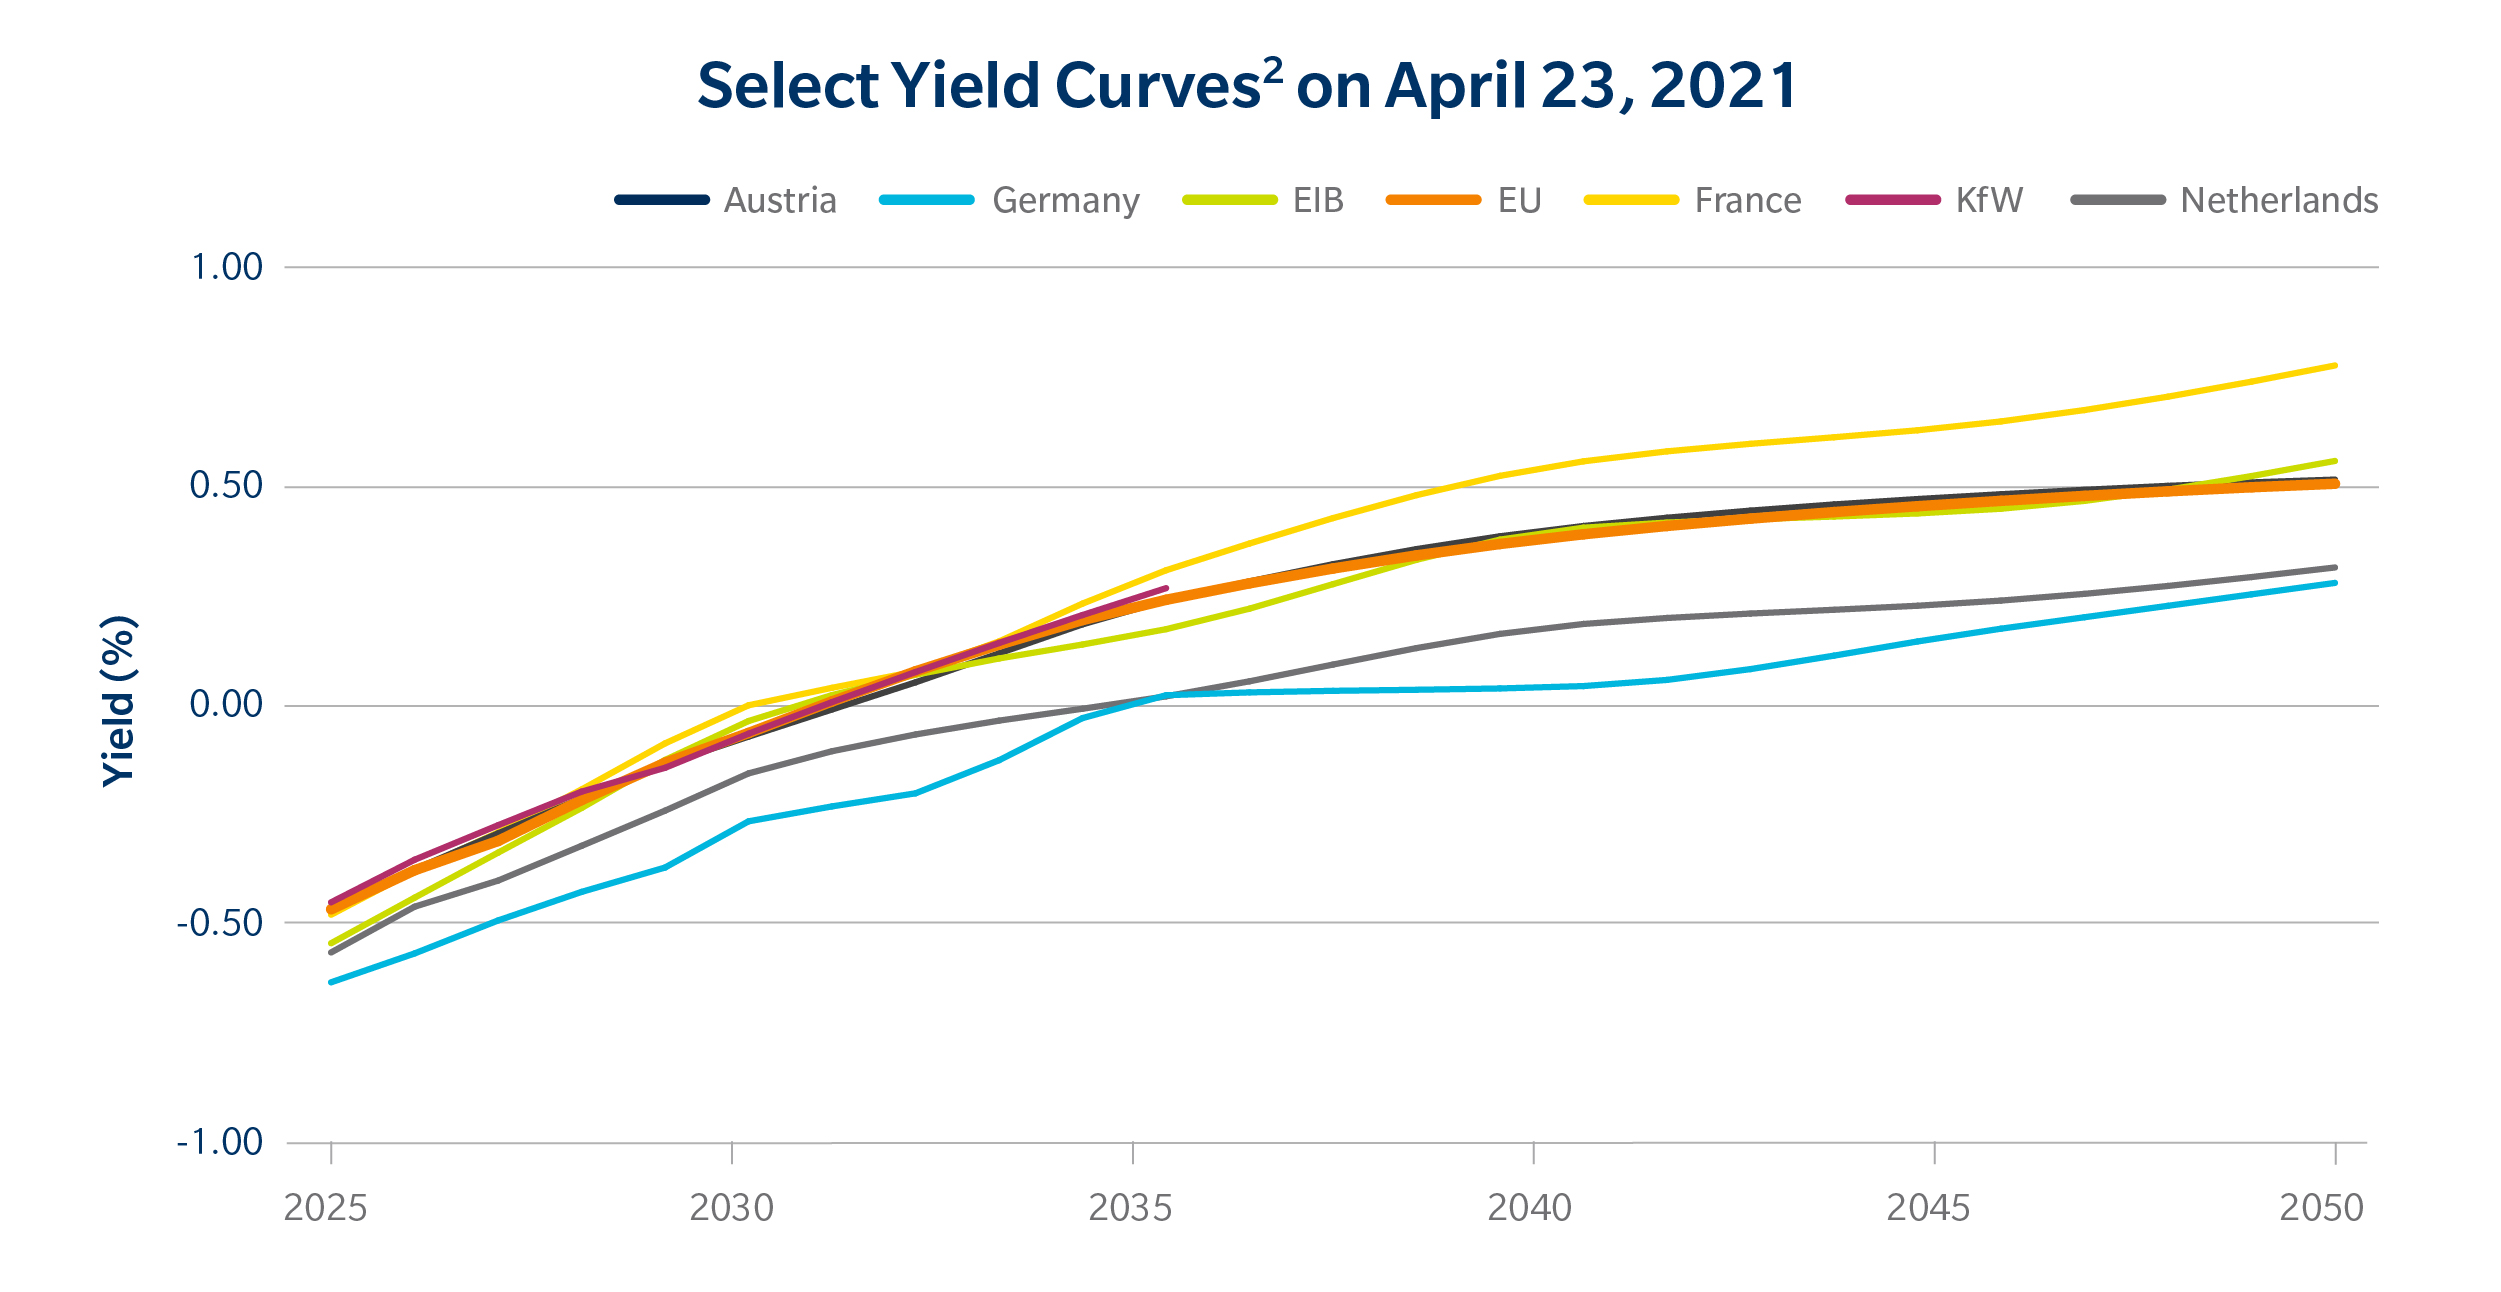
Source: Tradeweb
EU issuance also appears to be influencing performance across the European government and SSA bond sectors. Since last July, just before the EU announced its funding plans, the debt of borrowers from France to the EIB has tightened to within 3bp of each other around the 10-year point, from 8bp range last summer (see Figure 4). That suggests the EU’s funding actions, as well as the ECB’s Pandemic Emergency Purchase Programme, may have positive impacts on the region’s debt in general.
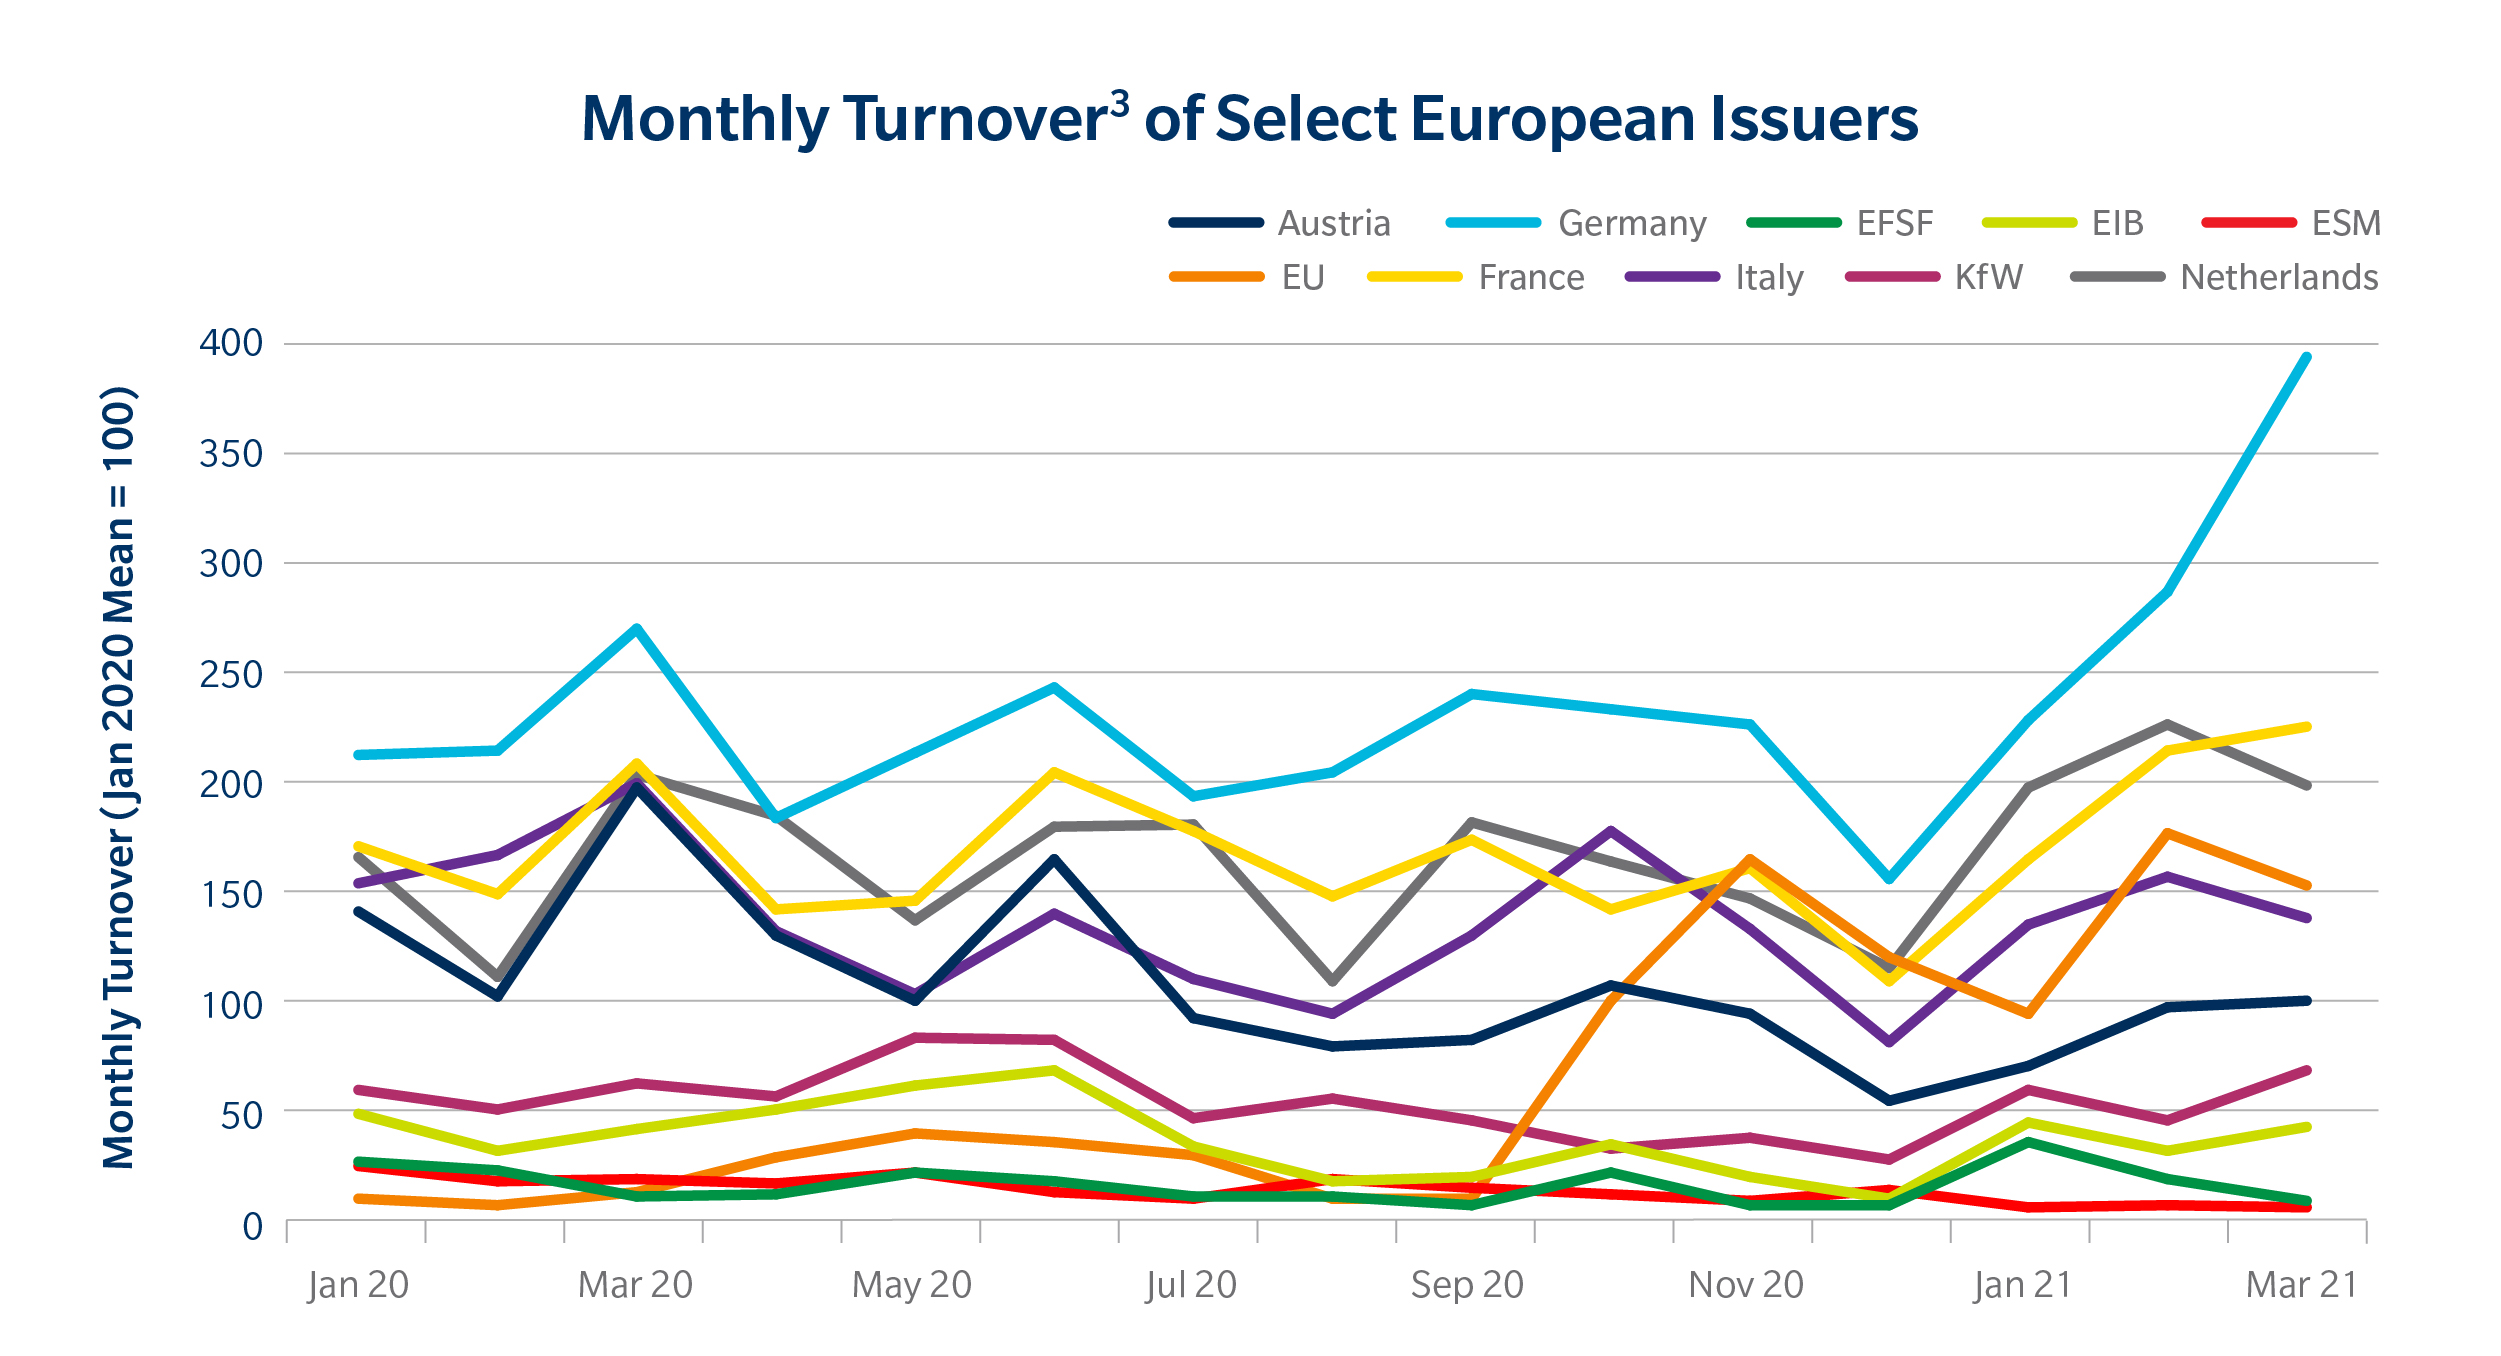
On turnover rate, its bonds are now similar to Italy, a top-three European borrower by this metric (see Figure 5).
SURE propels EU Bond liquidity
Credit the sale of SURE bonds last October for accelerating the transformation of the EU’s market profile. The first block of bonds, sold on October 20th, saw significant demand, attracting the largest order book ever for a European bond issue. The EU soon followed up with two more sales in November, and a liquid, desirable borrower emerged.
The market response to this new paradigm was well apparent in yields, with the entire EU yield curve soon aligning with that of Austria and the EIB.
FIGURE 3
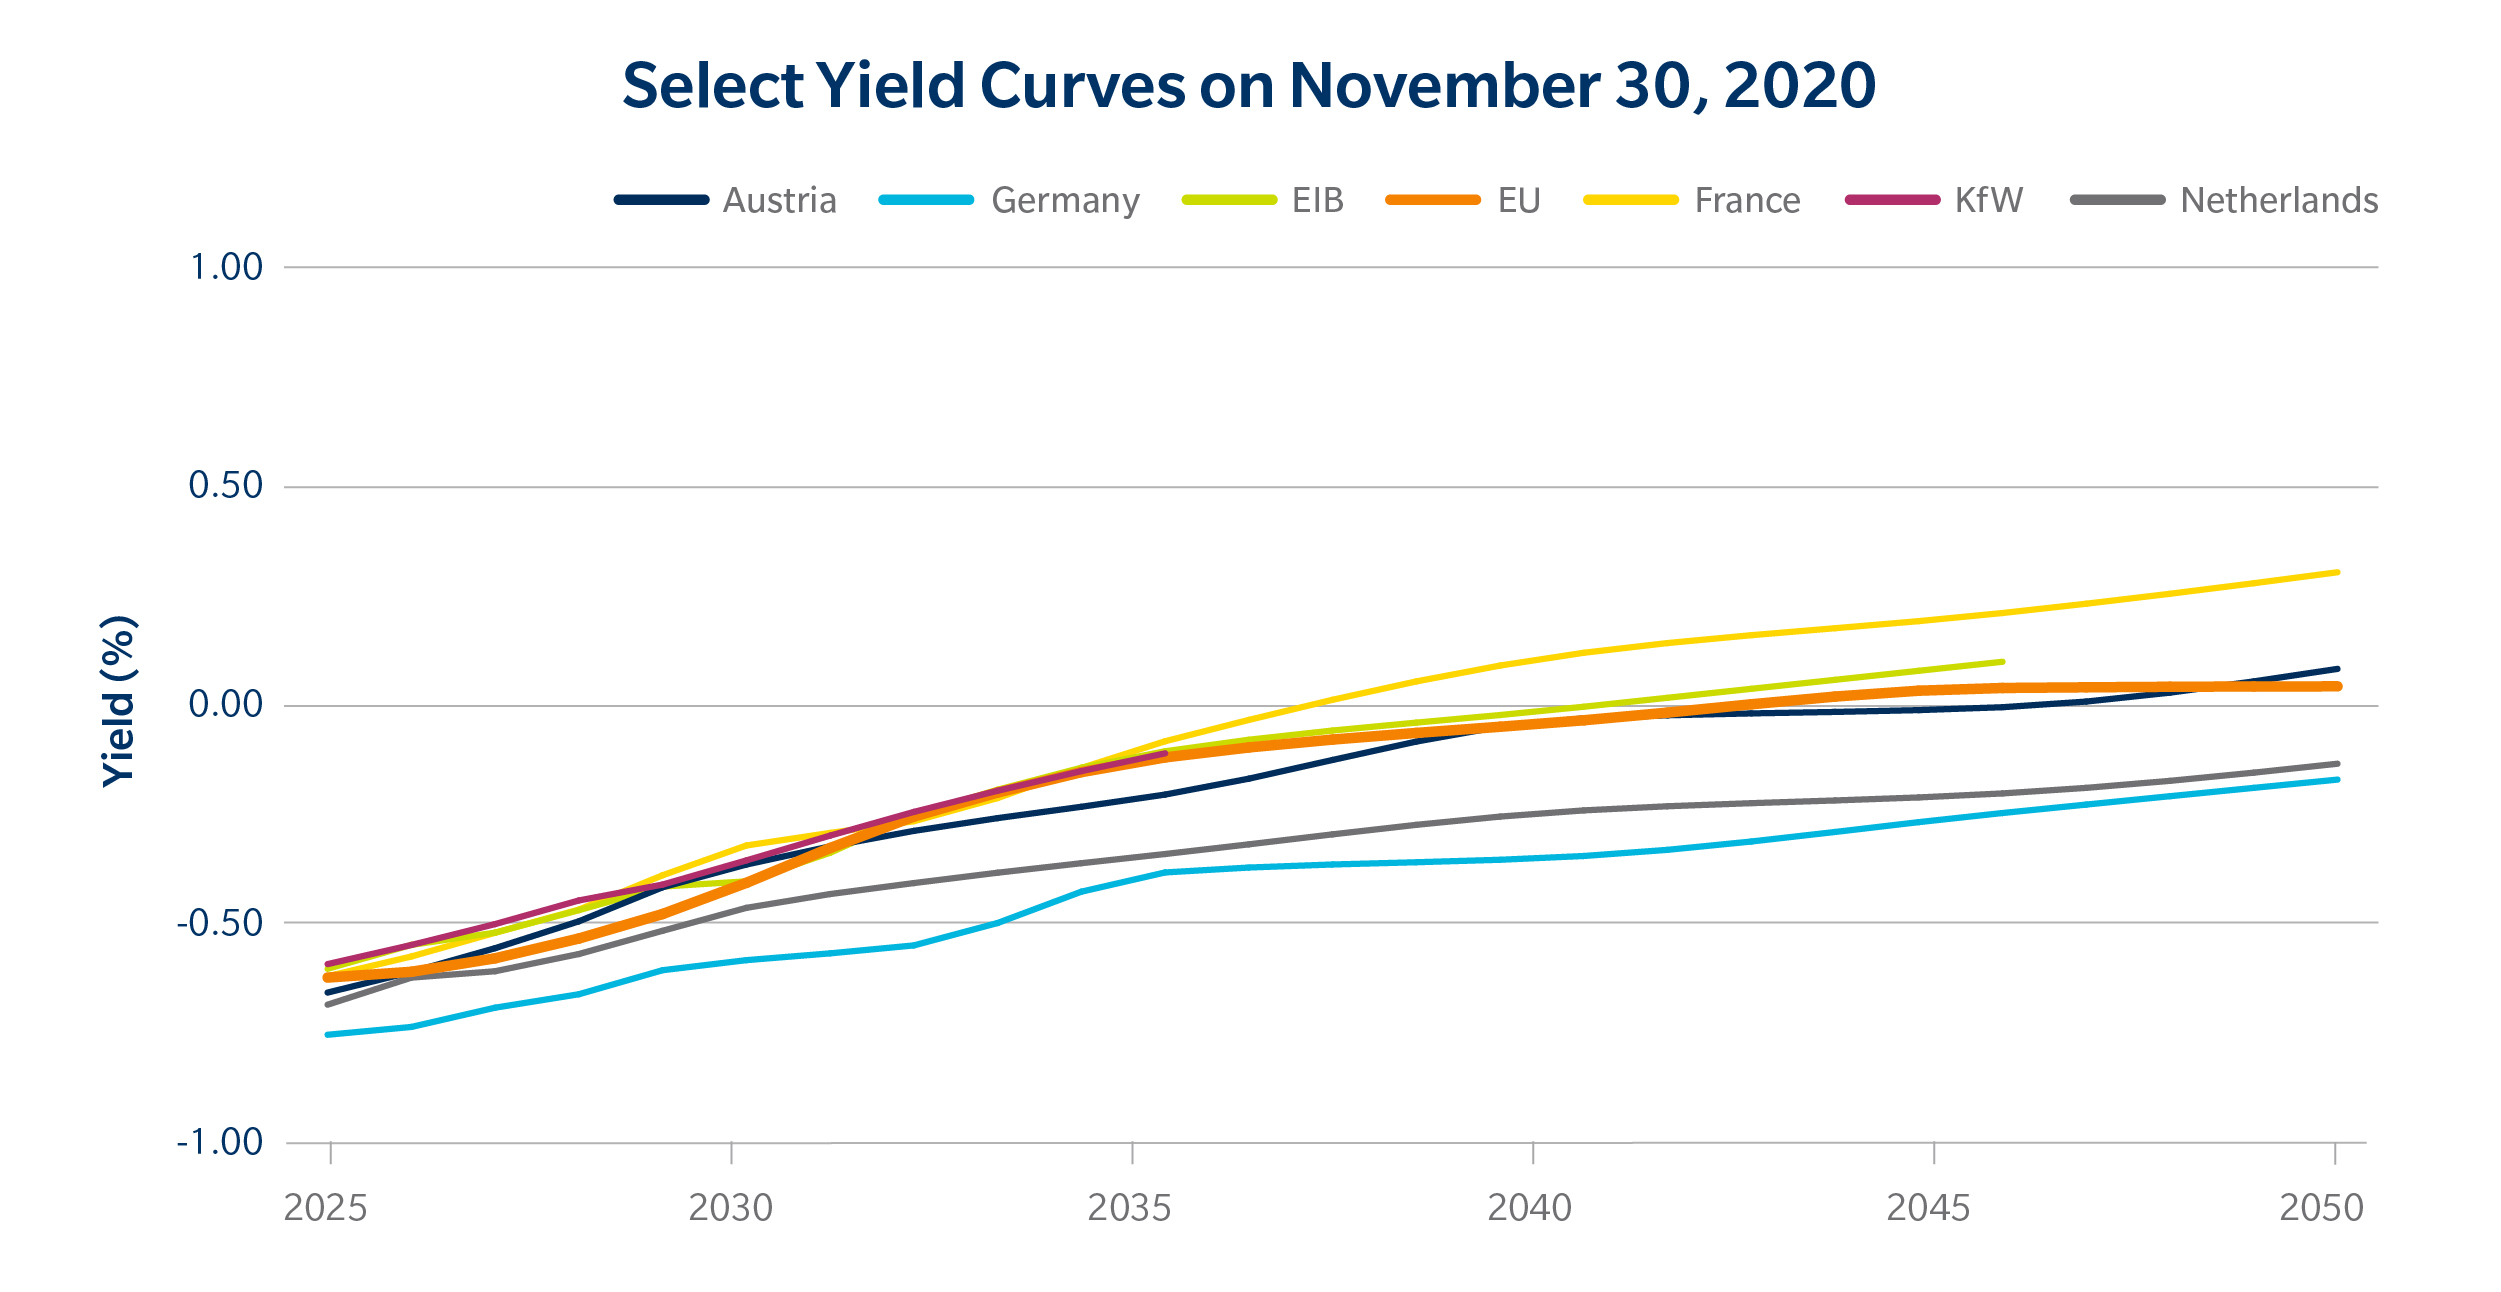
Source: Tradeweb
This is a significant change to where EU bonds traded before SURE. In July 2020, the EU yield curve was 10bp or higher compared to the EIB.
FIGURE 4
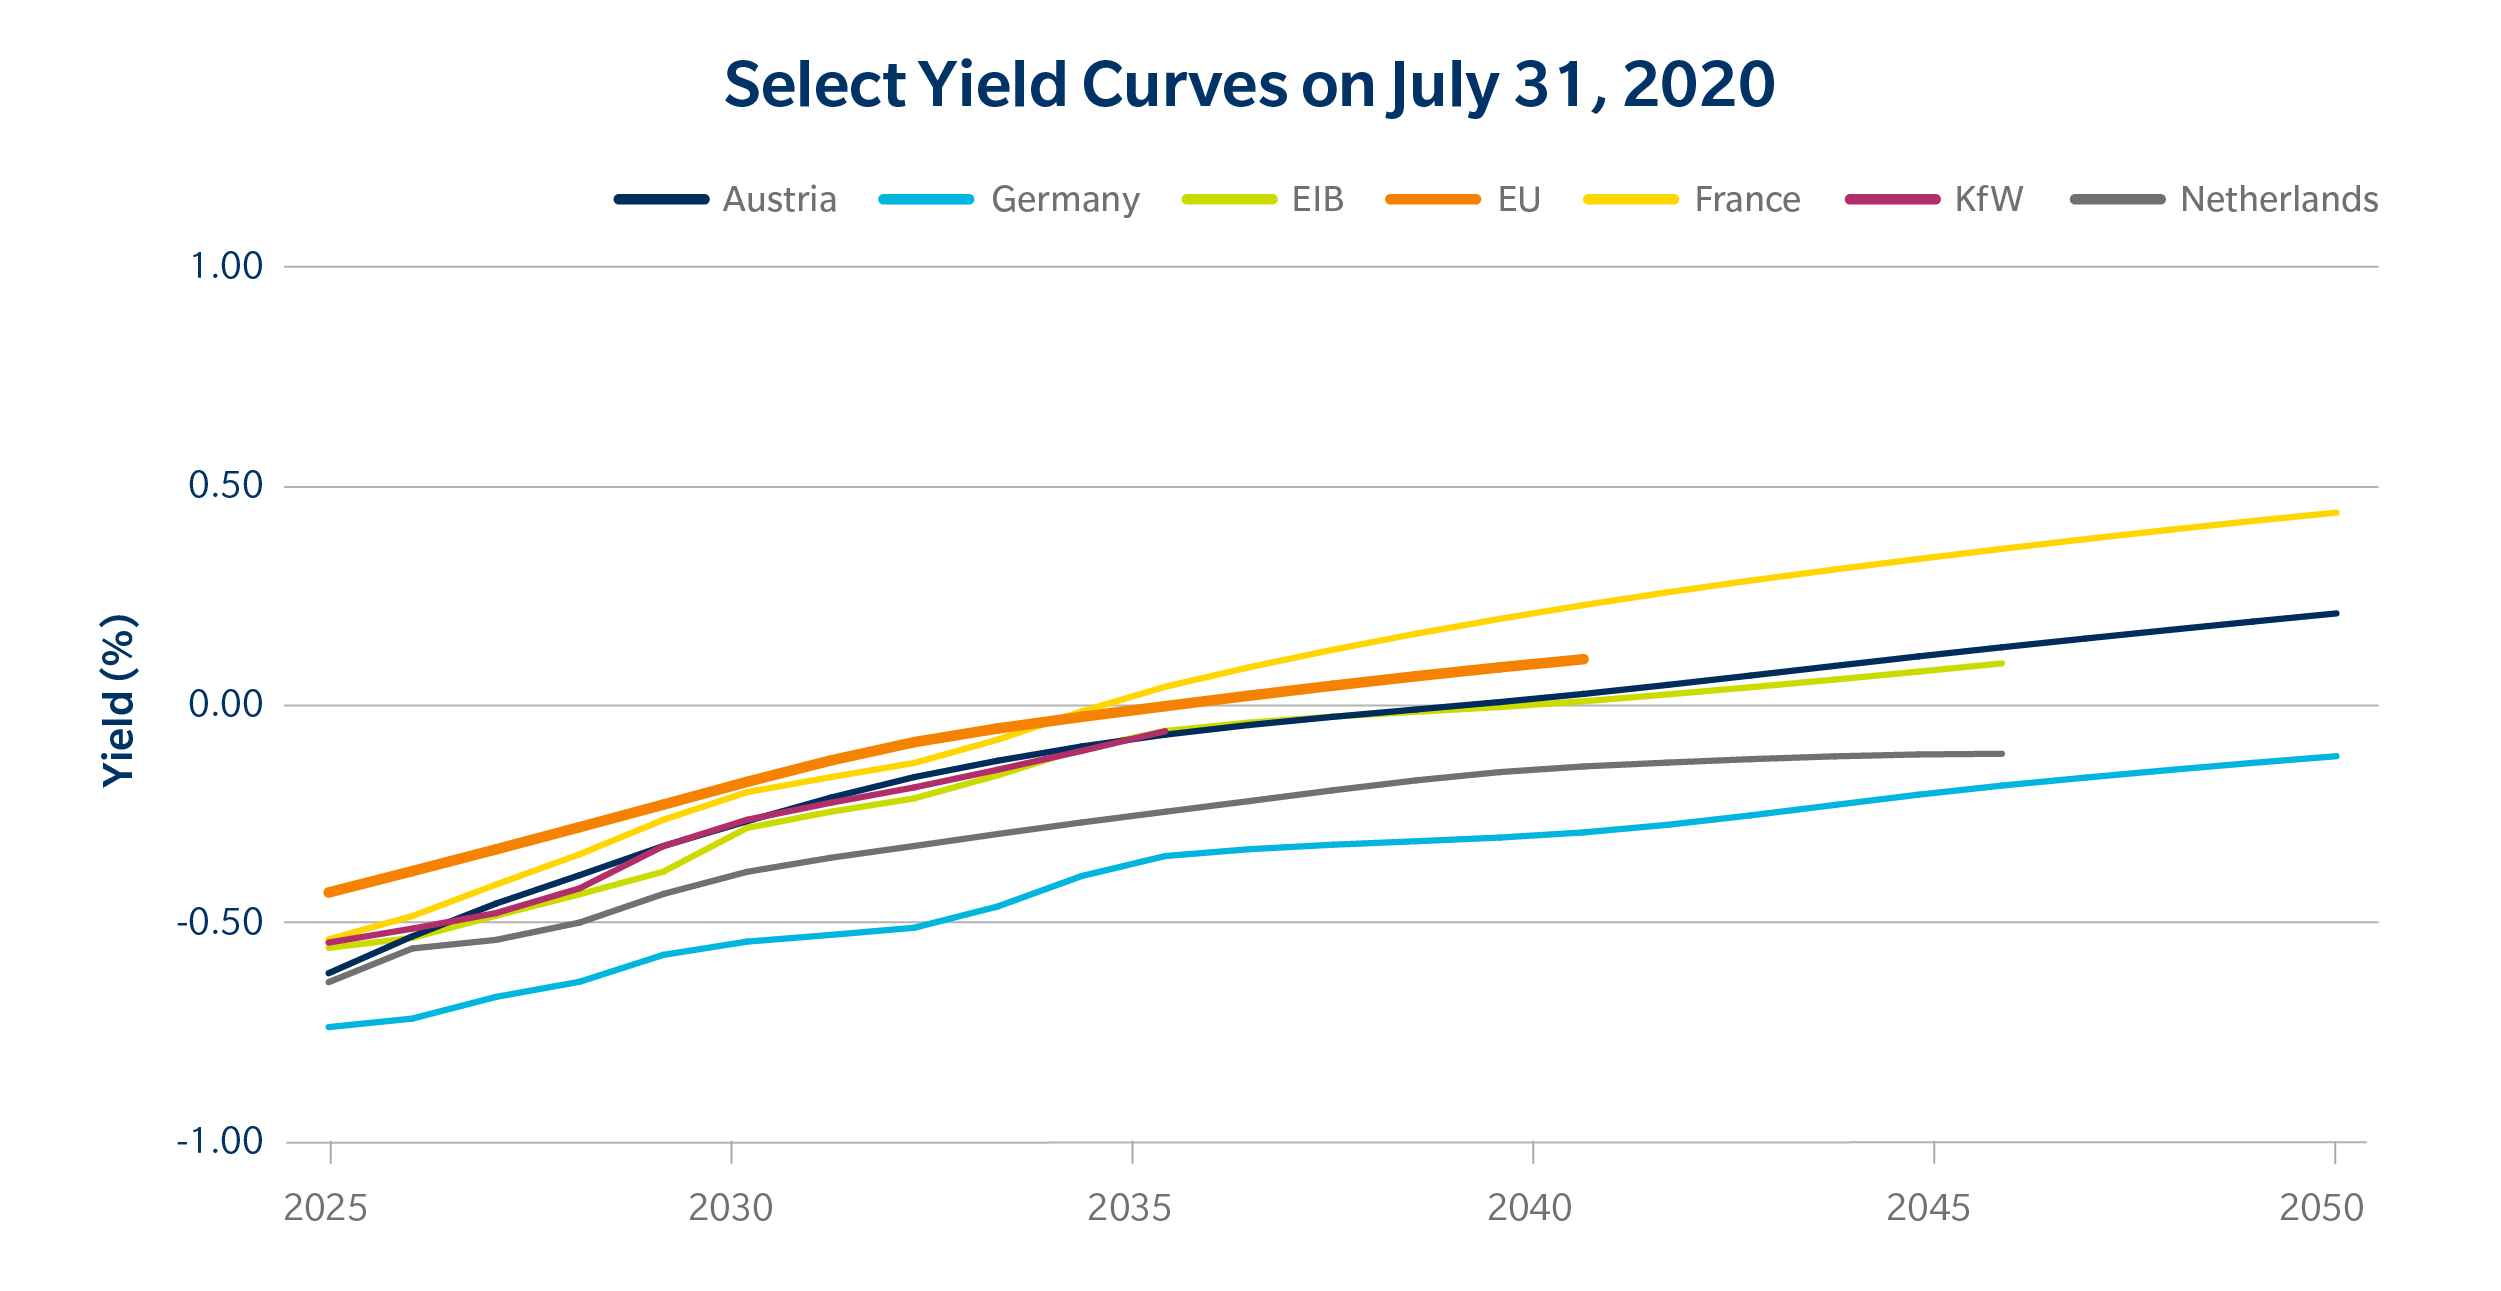
Source: Tradeweb
The SURE bond sale seemed to be the impetus for marked rise in turnover rates for EU bonds. In short order they are reaching a level similar to that of heavily traded Italian debt and a rate far higher than many other SSAs.
Prior to the SURE sale, the EU’s turnover rate was roughly in line with that of the European Stabilization Mechanism (ESM) and the European Financial Stability Facility (EFSF). Over the past decade, both, like the European Union itself, began selling debt to help support member countries during the European sovereign-debt crisis. Still, as issuers, their debt outstanding is limited and typically ends up in the hands of buy-and-hold, long-term investors.
FIGURE 5
Source: Tradeweb
The next generation of the EU
One could argue that the emergence of the EU as a European benchmark issuer was long overdue. With the impetus of funding Europe’s economic recovery driving it, it’s quickly developing its profile as a top liquid borrower in the region and a must-have name for investors. And rather than crowding out other European SSAs, it seems to be lifting other bonds in the region with its funding leadership, while fundamentally changing the European bond market.
![]()
Click here to download the blog.
[1] Simple monthly mean of issuer’s 7–10 year bonds’ end-of-day bid/ask spreads on Tradeweb, excluding outliers.
[2] For simplicity, yield curves were generated using Tradeweb end-of-day bid yields of all eligible EUR-denominated nominal coupon bonds with maturities between 4.5 and 35 years, and applying a piecewise cubic Hermite interpolating polynomial, and then interpolating yields for select end-of-year points. The methodology was chosen to ensure a consistent approach across issuers and take into consideration the relatively liquidity differences across issuers. Bonds with the following attributes were excluded from the interpolation/analysis: (1) maturities greater than 10 years and coupons > 1%; (2) end-of-day bid/ask spreads greater than 5bp; and (3) no trades in the last 8/10th of a month.
[3] Turnover defined as total volume traded on Tradeweb divided by the total debt outstanding for an issuer in 10-year equivalents for nominal bonds. Turnovers indexed to the average turnover across issuers in January 2020.
©Markets Media Europe 2025


 more valuable")


