


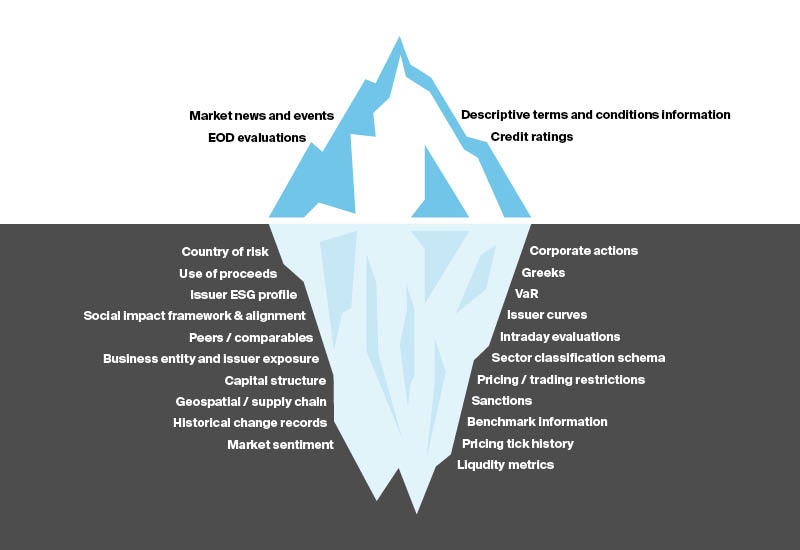
Beneath the surface: Visibility is only as good as your data

By David Varano, ICE Data Services Director, Business Development, and Jaimi Goldberg, ICE Data Services Solutions Specialist, Fixed Income
Financial market upheaval is typically accompanied by higher volatility and reduced liquidity as participants trim risk and tighten counterparty oversight. These hallmarks were evident during the Global Financial Crisis of 2008-09 when investment firms shunned the so-called “alphabet soup” of securitized products, selling or avoiding CLOs, CDOs, and MBS. Other examples include the EU sovereign debt crisis, when government bonds issued by “PIGS” nations (Portugal, Italy, Greece, and Spain) were blacklisted, and in the municipal space during major bankruptcy events. Astute risk management during these shakeouts relies on nimble, efficient analysis of information.
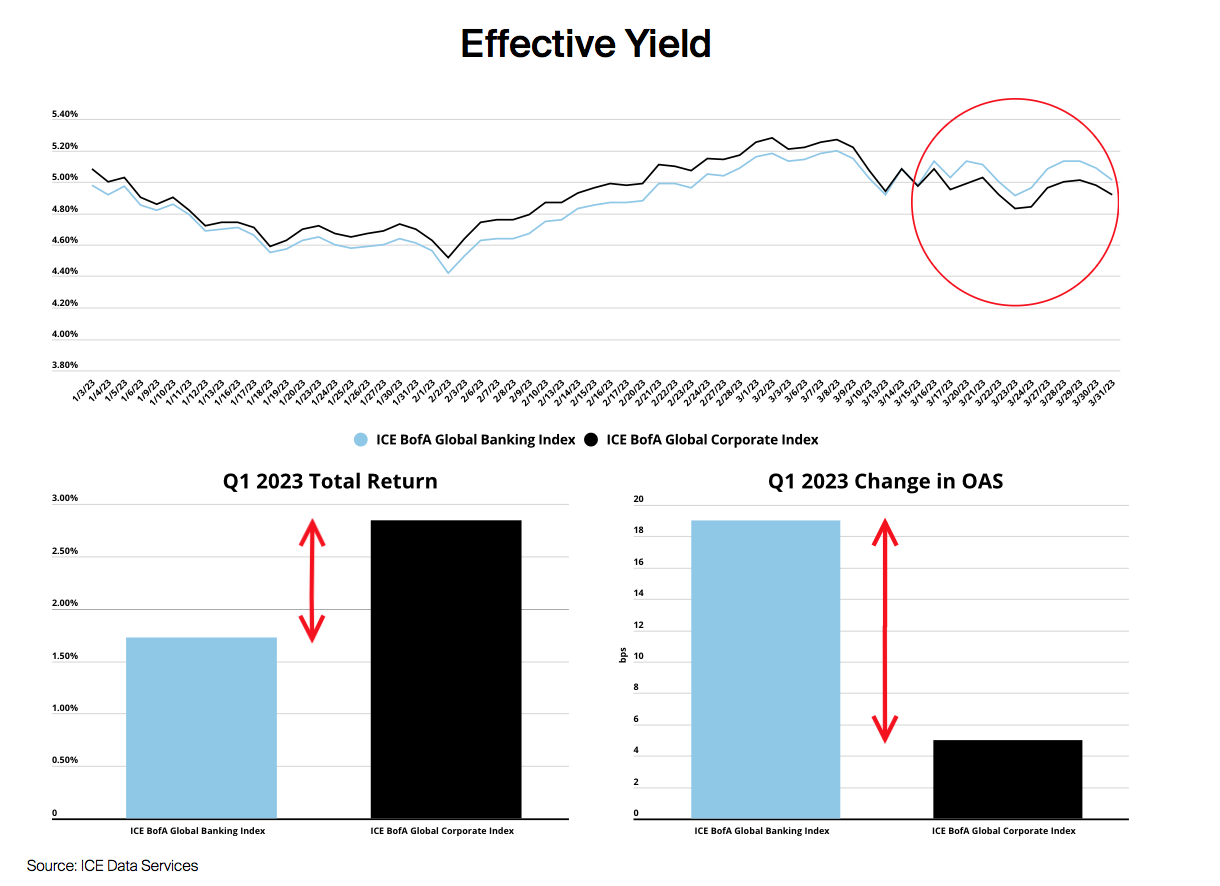
Let’s examine the banking sector fallout of March 2023. In the wake of a historically fast tightening cycle by the Federal Reserve, some banks which had invested aggressively in fixed-rate securities at much lower yields were unable to efficiently manage their asset liability mismatch amid a large-scale withdrawal of demand deposits. These so-called bank runs hit investor sentiment and fueled a selloff in equity and fixed income markets, ultimately culminating in emergency joint action by the U.S. government to guarantee both insured and uninsured deposits at two failed banks. After the dust settled, bonds issued by banks had significantly underperformed the broader corporate universe. In fact, the ICE BofA Global Banking Index total return lagged the ICE BofA Global Corporate Index by more than 110bps during the first three months of this year.
While many bank names were under pressure during this period, under the surface, there were significant differences between names. From the onset of the selloff, there was clear divergence based on institutional size. The deposit exodus from smaller banks into larger ones – either in search of higher rates or as a flight to quality – exacerbated the deterioration in bonds issued by relatively smaller institutions. Investors trying to manage risk during the chaos were well-served if they had access to rich data to quickly identify areas of concern.
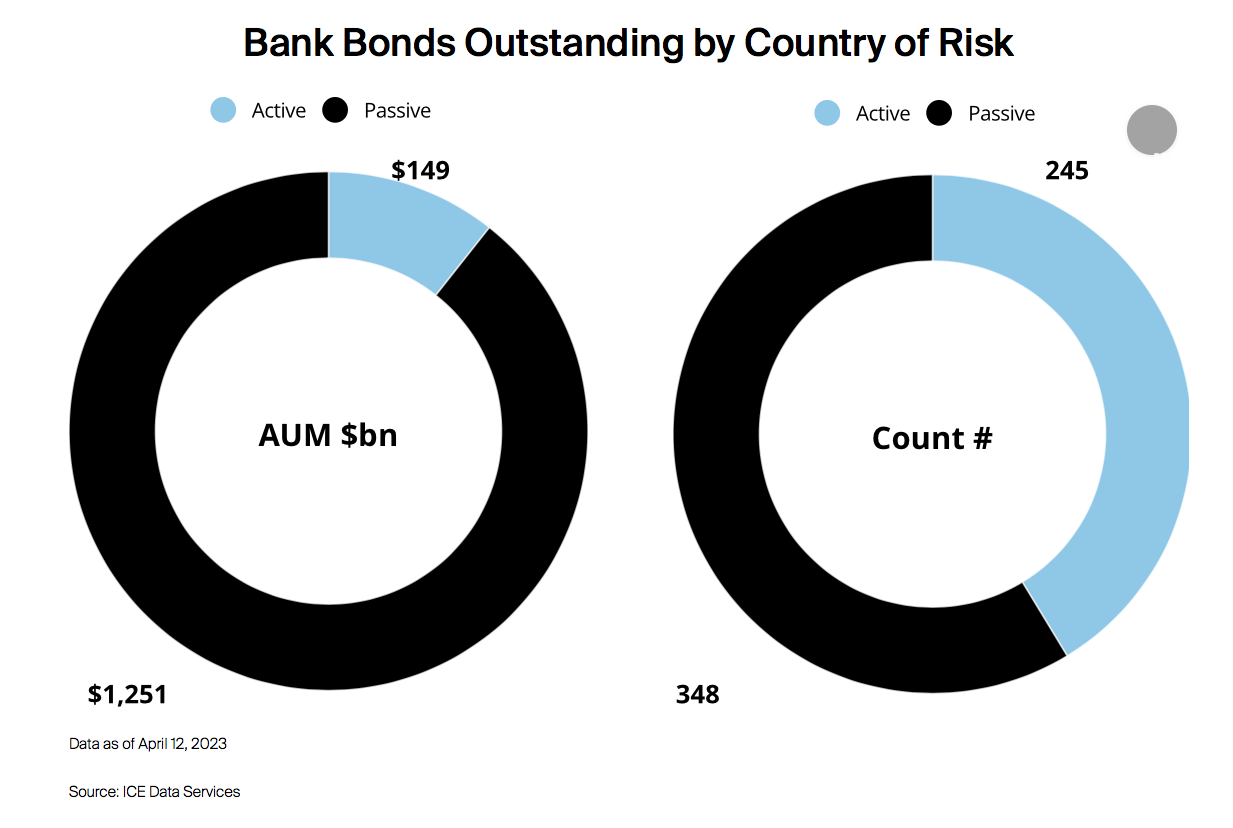
Using ICE Sector Classification Schema information to look across the global universe of outstanding bonds, we can see where regional bank debt is most prevalent around the globe. Combining Sector with the Country of Risk data element can help market participants determine where they may need to focus surveillance efforts. For example, a fund holding mainly Italian or Brazilian bonds might be less likely to have direct exposure to this corner of the market, whereas one with concentrations in issuances from the United States or Norway could warrant closer analysis.
Capital structure also became a defining feature of the upheaval in March. Against a backdrop of solvency fears among certain banks, the industry was divided into “haves” and “have-nots” with some of the failed regionals having their assets scooped up by more financially robust firms. Although bondholders generally view themselves as having priority above creditors such as shareholders, the nuances of any emergency liquidation or merger will be case-specific. Financial markets were dealt a curve ball when some Alternative Tier 1 (AT1) investors saw the value of their securities fall to zero as part of an acquisition of a troubled bank by one of its peers. Leveraging the Debt Rank Type element from ICE’s Reference Data service, we can identify fixed income securities across the capital structure and isolate for AT1 designations.
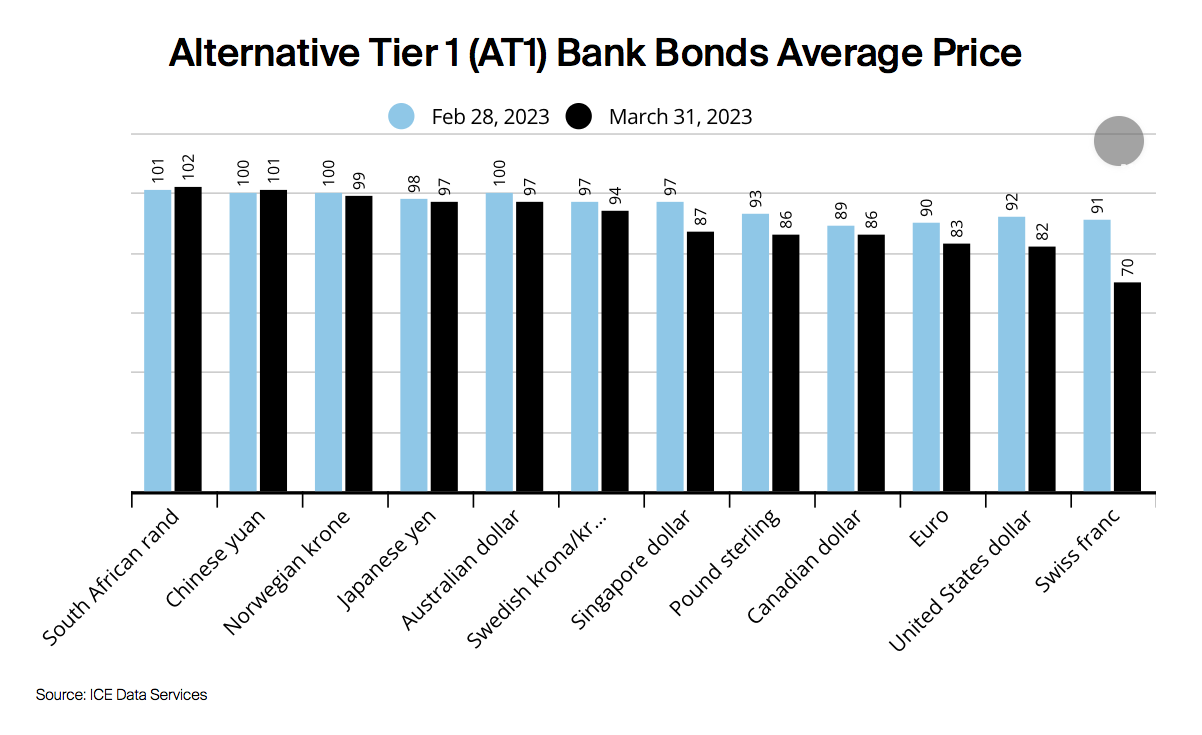
Although the complete writedown and resulting 100% principal loss was limited only to the acquired bank’s AT1 bonds, the entire sector came under pressure amid uncertainty over the legality of the regulator’s decision. Similar to utilizing geography to identify areas of focus, market participants can segment a portfolio by issue currency. In our example, this illuminates that Swiss Franc denominated AT1 bonds endured the steepest price declines, losing over 20 points on average from February to March month end, according to ICE Evaluated Pricing.
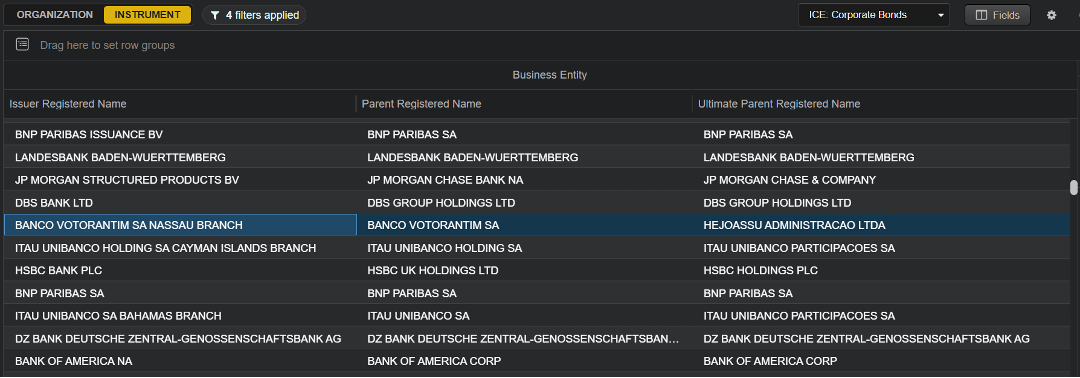
Access to high quality data is a necessity in being able to respond intelligently when financial markets are rocked by volatility. Here, it is crucial to be able to query and sift through large amounts of information quickly and efficiently. The ICE Data Viewer allows users to conduct top-down searches of the full universe of securities outstanding in a particular asset class. This functionality can be helpful to identify securities of interest based on varied criteria depending on the situation or use case. One pertinent example when monitoring credit or event risk is determining the relationship between subsidiaries and umbrella companies. Using the ICE Business Entity Service, clients are able to see clear lineage from a security’s issuer to its Parent, and Ultimate Parent. In the example screen below, we can see a bond issued by Banco Votorantim SA is actually a liability of Hejoassu Administracao Ltd.
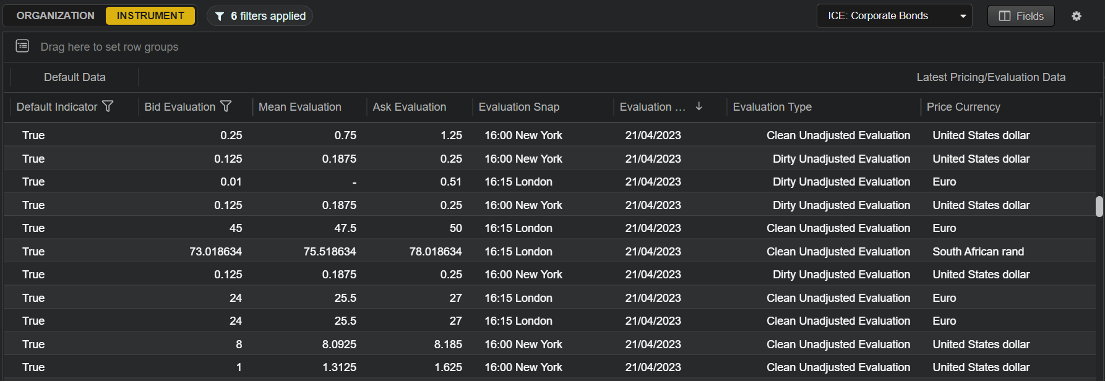
When mining information across different segments, market participants may wish to incorporate pricing to drill down to areas in need of close monitoring. The ICE Data Viewer provides access to ICE Evaluated Pricing information and descriptive fields that can be useful for quick segregation of a portfolio or fund’s holdings. These include items such as Default Indicator, Evaluation Type, and Evaluation Snap. In the example screen below, we can sort to view securities that have had a Corporate Action announcement of default, see the most recent Bid/Mean/Ask evaluations, whether those levels are being treated as ‘Clean’ or ‘Dirty’ prices with respect to accrued interest, and what time of day they are applicable to.
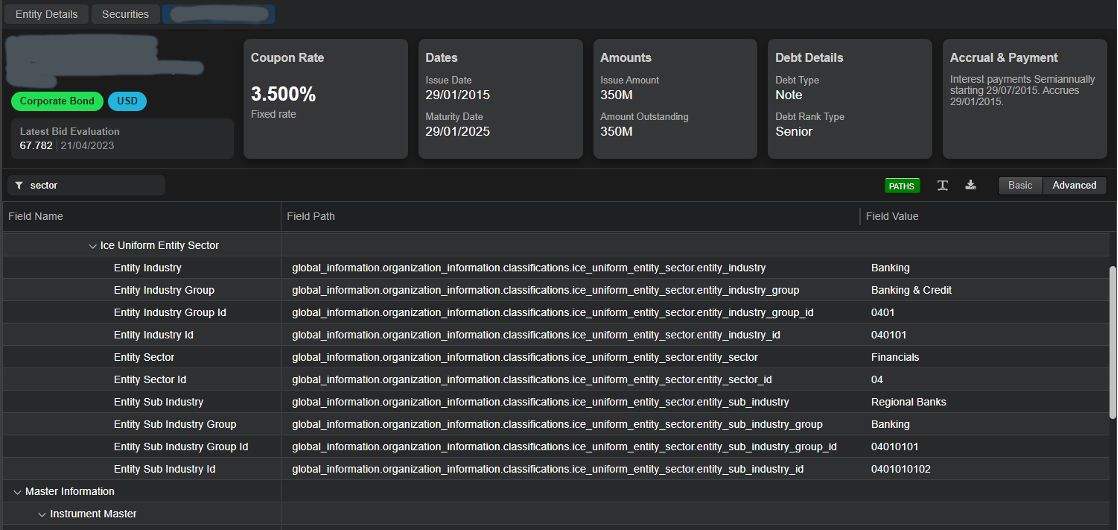
Once an area of interest is identified and the need to dive deeper into security specific information is deemed necessary, the ICE Data Viewer can be used to better analyze a bond’s moving parts. These not only span the traditional types of bond data that market participants use on a daily basis, but includes information from the ICE Sustainable Finance suite, which can help shed light on an issuer’s ESG profile among other things. This can allow a user to transition their research from a list of securities, to a single security. From a workflow perspective, the Viewer allows users to expose the Field Path to help bridge the gap between our UI and our file- or feed-based deliveries. This functionality can help front office personas communicate more efficiently to their product development or technology teams.
As data proliferates the capital markets landscape, event-driven volatility and trading disruptions can be increasingly difficult to manage. Having access to the right data and proper tools can provide a competitive edge.
![]()
This document contains proprietary information of Intercontinental Exchange, Inc. and/or its affiliates (the “ICE Group”) and is provided for informational purposes only. It is not to be published, reproduced, copied, modified, disclosed or used in any way without the express written consent of the ICE Group.
Additional information regarding the terms of use of this article or any part thereof can be found here.

©Markets Media Europe 2026


 more valuable")


