Capped estimated investment grade (IG) and high yield (HY) portfolio trading volumes were the highest year-to-date in April 2025, representing approximately 10% of total TRACE volumes.
This marks a slight dip from full-year 2024 figures of 11%, however, and a downward tick in the use of portfolio trading in the IG markets.
In IG, capped portfolio trading has continued a decline that began in January 2025. Despite reaching record highs in December 2024, taking 15% of TRACE volumes for the asset class, this figure fell sharply to approximately 10% in January.
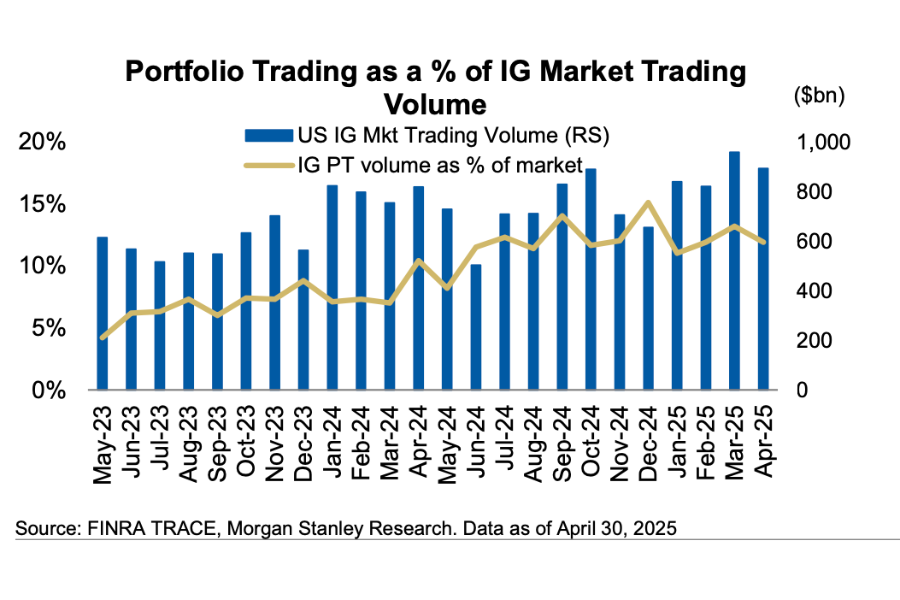
Although a slight recovery was seen in March, April results dipped alongside declining trading volumes for the asset class. Reported trades fell from record highs of US$126 billion in March, but remained above monthly averages year-to-date.
By contrast, portfolio trading in the US high yield market continued its steady rise in April to represent 16% of total HY trading volumes.
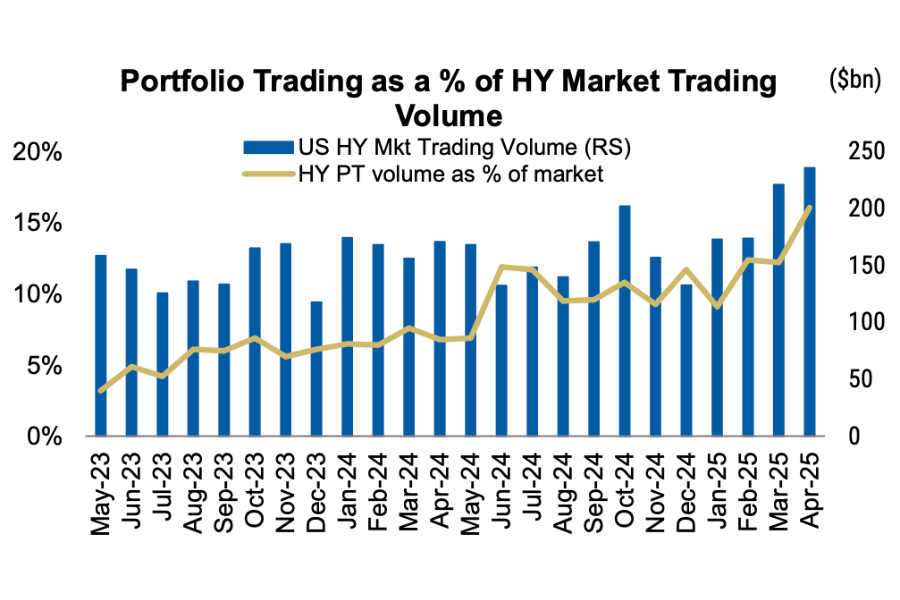
While overall trading volumes are well below those in the IG market, HY is growing at a more rapid pace – a trend noted by Morgan Stanley in Q4 2024 – and portfolio trading is considerably more well-used in the market.
At TradeWeb, portfolio trading volumes were US$61.6 billion in April. Liane Fahey, head of European institutional credit at the company, observed: “Portfolio trading has become a widely used, reliable method for executing trades and managing risk, particularly during periods of market volatility. As the market continues to evolve, its adoption is likely to continue to expand, as it further embeds itself as an essential part of credit traders’ toolkit.”
Adoption is not only being seen in the US. European portfolio trading volumes exceeded €12 billion at Tradeweb in March – a 78% year-on-year increase, the firm stated.
©Markets Media Europe 2025