



At the end of last month, MarketAxess was acquired by ICE and announced that it would no longer publish its monthly statistics. Data from June shows that the firm has lost its hold on the US credit e-trading market.
READ MORE: ICE buys MarketAxess
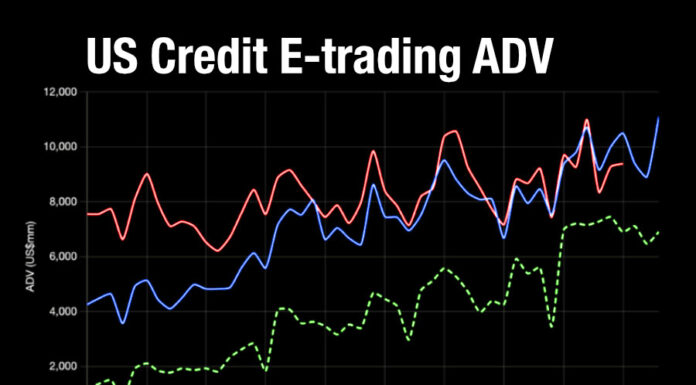
Having started the race strong in 2022, MarketAxess was US$1.1 billion behind Tradeweb fully-electronic US credit trading average daily volumes (ADV) at last count. After an up-and-down dogfight in the first few months of 2026, Tradeweb has taken its biggest lead to date.
Source: company reports
In June, Tradeweb reported US$9.3 billion ADV in fully-electronic investment grade (IG) trading ADV, up 4.5% MoM and 31% YoY.
In the high yield (HY) space, ADV was up 5.8% MoM and 16.7% YoY to US$1.16 billion.
Using these figures, across HY and IG Tradeweb took a 17.99% share of TRACE ADV.
The firm has been outperforming yearly TRACE ADV growth since April.
Source: company reports
MarketAxess, by contrast, reported US$7.8 billion in US IG e-trading and US$1.6 billion in US HY e-trading, both excluding single-dealer portfolio trades. In IG, this marked a 1% increase MoM and an 11% increase YoY. In HY, ADV was up 3% MoM and 6% YoY.
These figures suggest a 16% share of TRACE ADV. MarketAxess has lagged TRACE ADV growth near-consistently since May 2025.
In the company’s Q1 earnings call, CEO Chris Concannon highlighted the firm’s success – outside of US credit.
“Growth in revenue outside US credit was 20% in the quarter,” he said.
Source: company reports
Trumid reported US$9.6 billion in total credit ADV in June, and does not break down how much of this volume is purely electronic. Global Trading estimates point to US$6.85 billion in totally electronic ADV over the month.
In both cases, volumes were down 7.7% MoM and up 68% YoY.
The road ahead
MarketAxess has not shared its July figures, following the ICE acquisition.
Tradeweb reported US$7.1 billion ADV in IG for the month, up 17.81% YoY and down 9.59% MoM. In the high yield (HY) space, ADV of US$962 million marked a 0.31% increase YoY but a 16.82% MoM decline.
Trumid reported US$9.9 billion in ADV, up 57% YoY and 3% MoM. It also stated that it gained a record overall market share over the month.
Methodology Note
Trumid does not disaggregate fully electronic trades from electronically processed ones, while Tradeweb and MarketAxess both report fully electronic figures. To compare the three, The DESK estimates Trumid’s fully electronic ADV as a proportion of its reported total.
From 2022 to mid-2026 we applied a fixed 60%, a figure derived from Tradeweb’s own fully electronic share of its US credit volumes at the time the estimate was introduced. From August 2026 we calculate the proportion dynamically, using a twelve-month rolling average of Tradeweb’s fully electronic share rather than a single fixed point. On the most recent data this gives approximately 71%.
The change reflects a real shift in the market. Tradeweb’s fully electronic share of its US credit volumes has risen from around 59% in late 2022 to around 73% in 2026 as electronification has advanced. A fixed proportion set in 2022 increasingly understated Trumid’s electronic activity; the rolling calculation keeps the estimate aligned with observable market structure, which is what the original 60% was intended to do.
Charts published before August 2026 are static images and continue to show the figures as calculated at the time. We have not restated them. Readers comparing an earlier chart with a current one will find Trumid’s estimated electronic volumes higher on the newer basis.
We have asked Trumid and MarketAxess to provide their electronic and processed split directly. If either does, we will use reported figures in place of the estimate and note the change here.
©Markets Media Europe 2026