


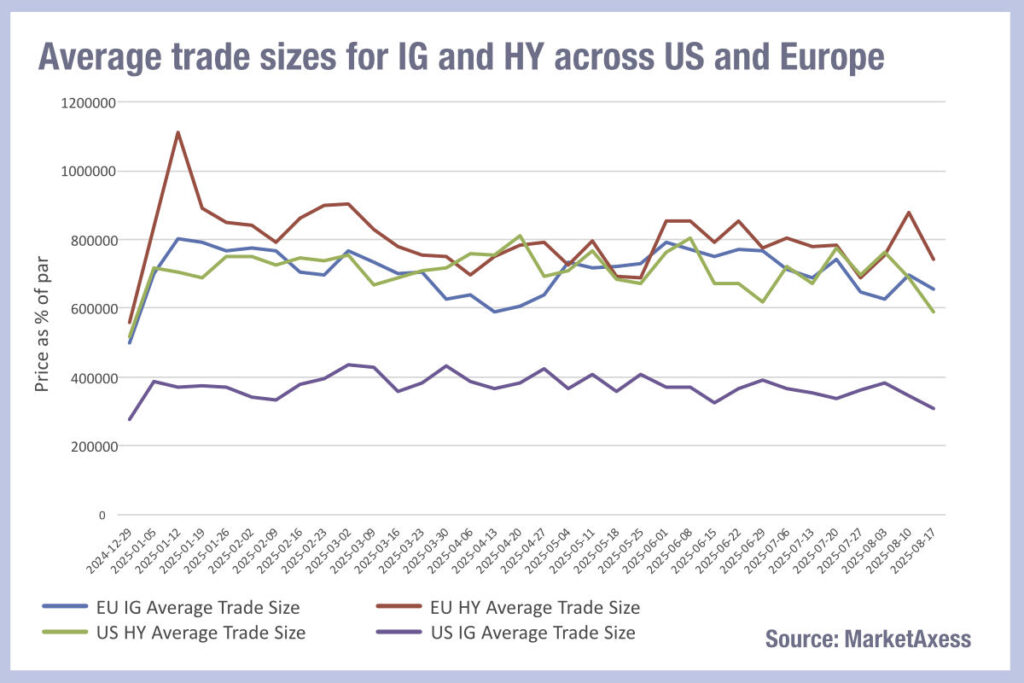
Recent reports that high yield (HY) trades are increasing in size and investment grade (IG) are shrinking, have ignored the year-on-year growth of European investment grade trade sizes; in fact it is US IG which is the exception.
Looking at MarketAxess’s TraX data we can see that average trade sizes for IG in Europe and US (marked as a % of par in the chart rather than currency) are considerably different. European investment grade, high yield and US high yield have all been trading in the 600k-800k price-%-of-par range with European HY spiking higher at points.
By contrast, US IG has been around and slightly below the 400k price-%-of-par range.
Comparing the bid-ask spreads for corporate bond markets we can see that European and US markets are converging in cost of liquidity for investment grade, after Europe had been seeing slightly lower trading costs since the start of the year.
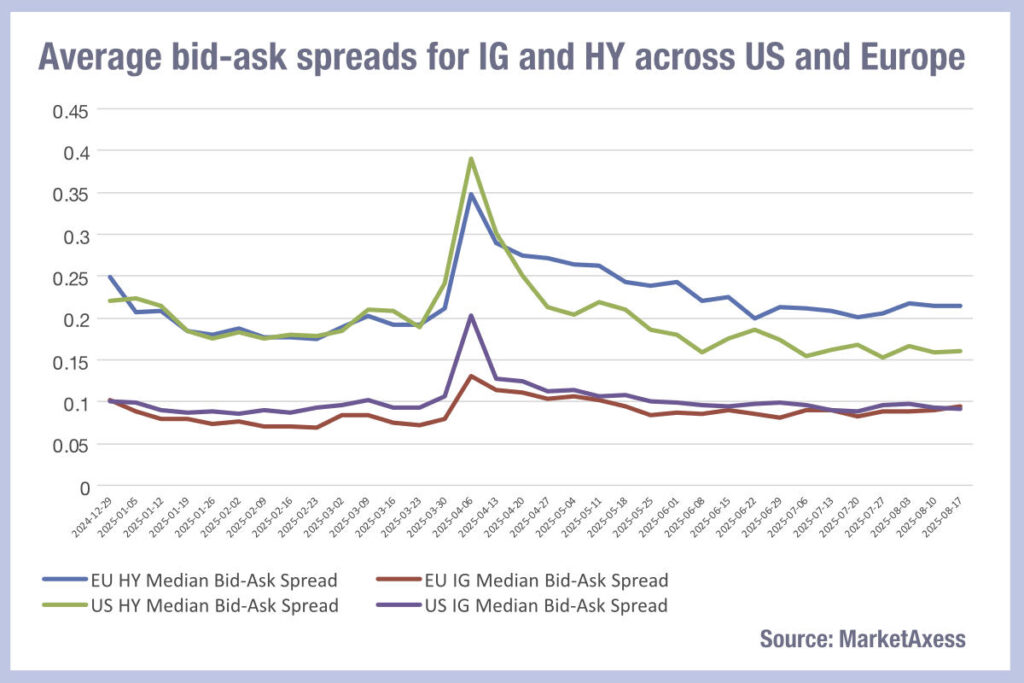
The explanation for historical divergence was based upon the ‘over-broked’ markets in Europe which inevitably drove down prices through competition.
High yield bid-ask spreads had been closely aligned across both Europe and the US until June, when the US saw trading costs fall by a greater margin than in Europe.
One headwind to European bid-ask spreads could stem from credit spreads widening, increasing the cost of carry for dealers and therefore putting pressure on liquidity pricing. That may also be reflected in the level of correlation between investment trade sizes – which has been high – and that of HY trades which has been low, given the greater sensitivity of HY to credit spreads.
If we consider the evolution of electronic trading as a potential factor, the capacity to trade more efficiently is reflected in the broadly similar patterns of rising and falling bid-ask spreads between instrument classes, which supports the even application of electronic trading. The difference in trade sizes may then reflect the different trading protocols that are used to execute orders, including automated, all-to-all, direct block and portfolio trades, leading to different sized prints.
However, it is also clear that trading costs have become more highly variable in the summer months as trading volumes decline and traders need to keep a close eye on their data to benchmark execution.
©Markets Media Europe 2025


