


In comp vs non-comp trading polarises across electronic and voice.
The DESK’s Trading Protocols Survey 2022 has found a continuing movement of corporate bond trades placed in competition (in-comp) away from voice trading and messaging, and into electronic request for quotes (RFQs) since 2020 when the research was first conducted.
In our survey we ask participants to report the proportion of their trading they channel via each protocol, along with details of the firm’s headquarters, portfolios and assets under management (AUM).
As a result we can assess the overall use of trading protocols for active vs passive funds. but also a more nuanced view based on company size and geography.
Overall protocol use for active vs passive portfolios
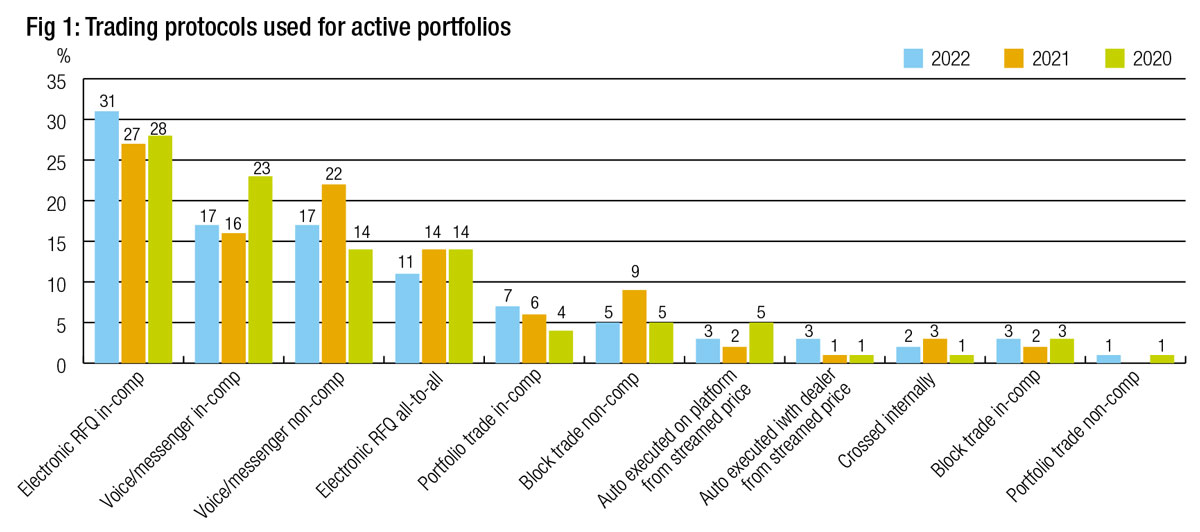
For actively managed portfolios, in-comp trading has increased for electronic RFQs (31%) and portfolio trading (7%) up from 28% and 4% in 2020.
At the same time non-comp trading has increased since 2020 for voice trading (17% up from 14%) and auto-execution via direct from dealer streamed pricing (3% up from 1%).
Traders for active portfolios have seen in-comp voice and messenger trading drop by five percentage points to 17% in 2022 from 23% in 2020. All-to-all e-trading and auto-execution via a platform also fell slightly, to 11% and 3% respectively (see Fig 1).
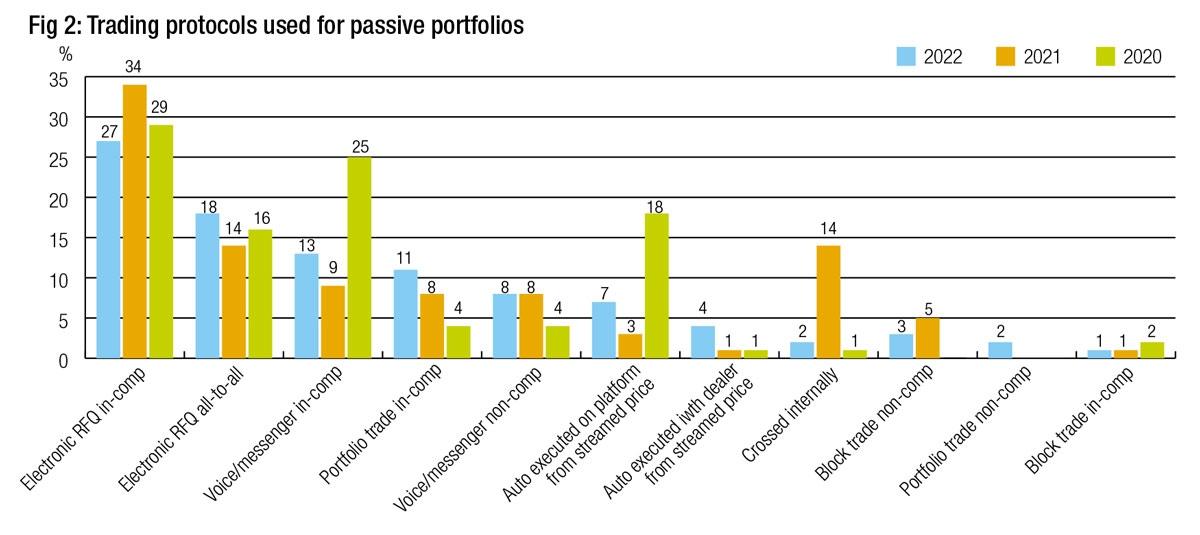
By contrast, traders for passive portfolios saw a decline in the use of in-comp RFQs (27% from 29%) and an increase in all-to-all RFQ use (18% from 16%). The drop-off in the use of in-comp voice trading was even more pronounced for passive portfolios, falling from 25% in 2020 to 13% this year. Auto-ex via a platform based on a streamed price also dropped markedly, to 7% from 18% (see Fig 2).
The anomalies in 2021
When we look at the data it is apparent that 2021 saw spikes in some activity and declines in other activity which appeared somewhat anomalous. Having analysed the data by company size, portfolio type and trading protocol, it is apparent that in 2021 a significant increase in non-comp trading protocols appeared to be behind these anomalies, and also skewed towards trading activity for passive funds.
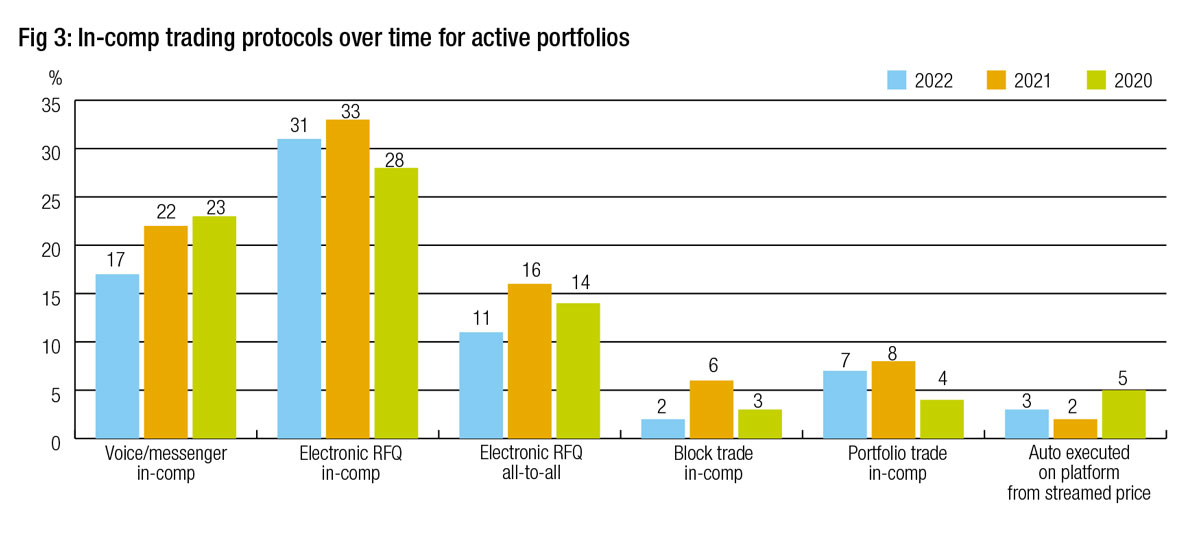
Looking at in-comp protocols for active portfolios similar changes are there but within a <5% range (see Fig 3).
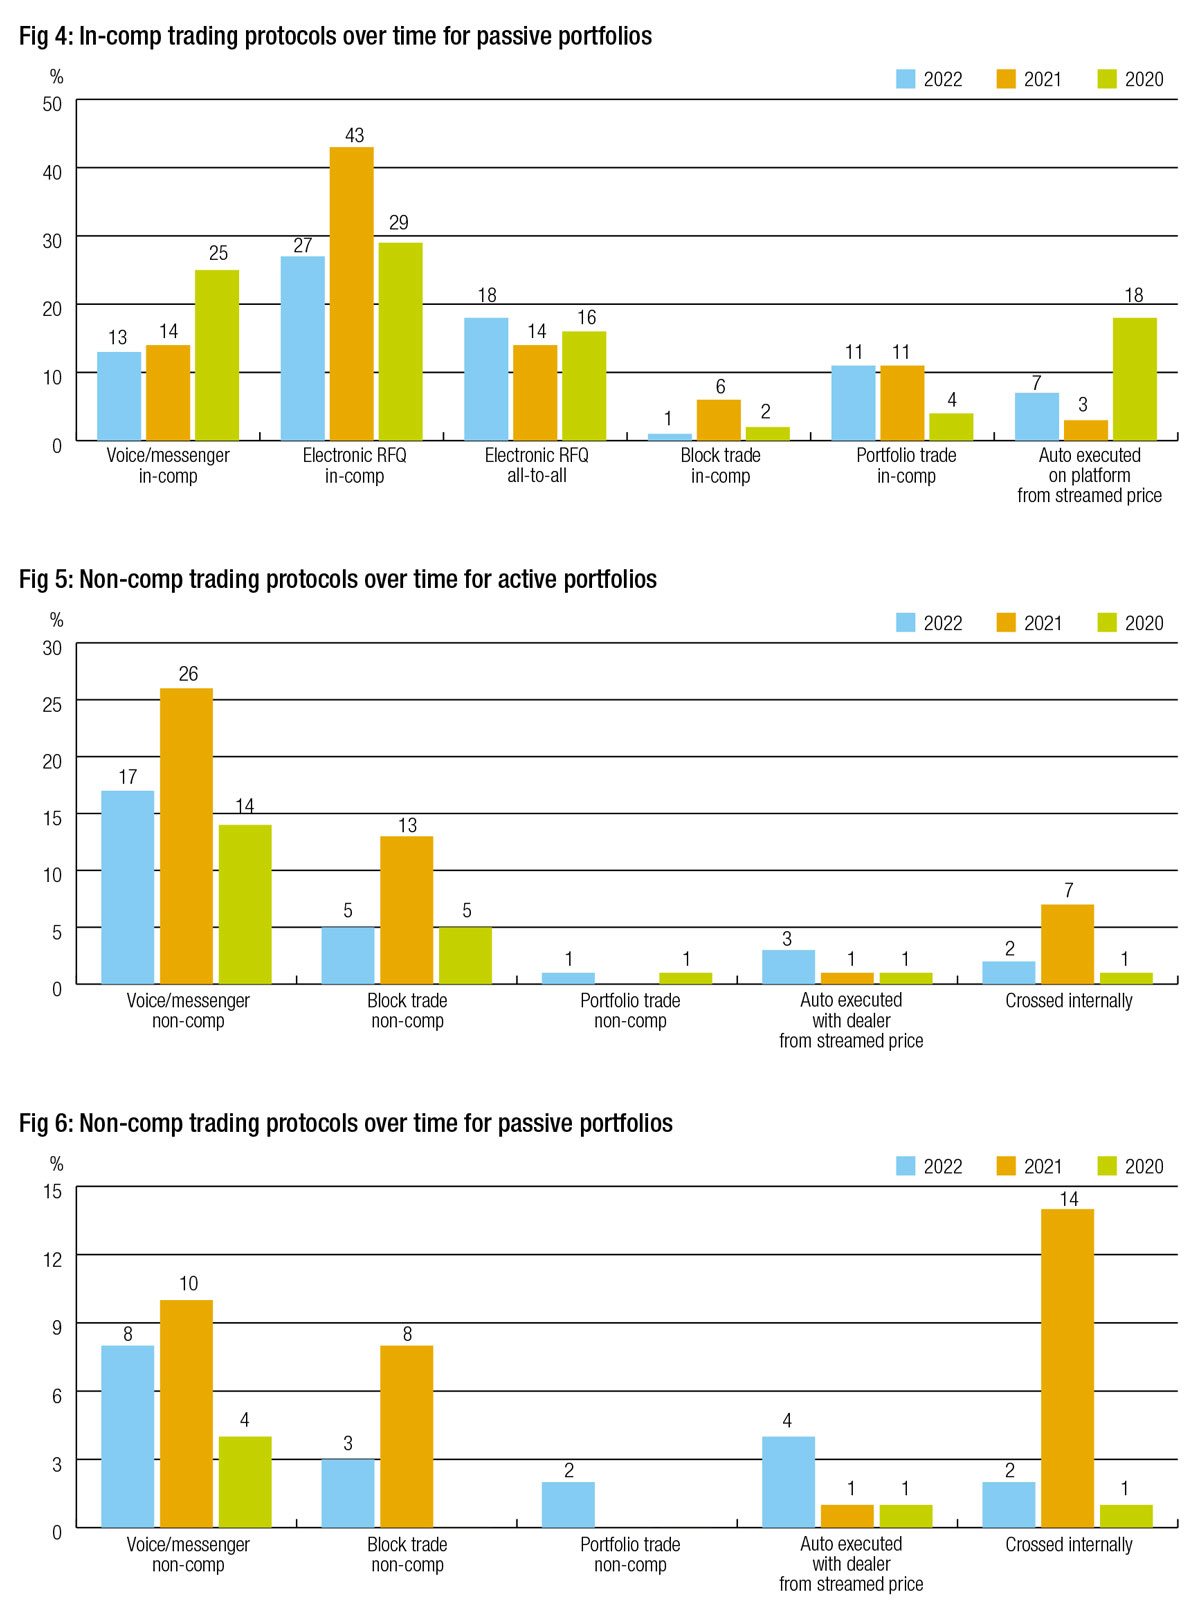
In passive funds we see far bigger moves for in-comp RFQ and in-comp voice/messaging (see Fig 4).
Looking at non-comp trading there are increases for voice messaging, block trades and internal crossing for both active and passive portfolios, with other protocols largely flat (see Fig 5 and Fig 6).
Although this report does not speculate as to causes, it is curious to note those differences given the relative stability of markets in 2021 to 2020 (which had one period of outsized market volatility in March) and 2022 which has seen far more volatile markets triggered by both war and inflation/central banks activity.
Protocol use based on company size
When we break down protocol use based upon company size we see more significant differences. With firms split by AUM of <US$50bn-100bn (lower tier), >US$100bn- US$500bn (mid-tier) and >US500bn-1tn (top tier), we can clearly see that for active portfolios, in comp voice and messaging is used by top tier firms far less than by mid- and lower-tier firms (see Fig 7).
Equally non-comp block trades and using dealer streams to auto-execute trades is far more popular with top tier firms than others (see Fig 8). Each of these masks information leakage, and larger AUM firms are more likely to trade outsized orders, which carry greater cost if they suffer from information leakage. This may be a reason for the difference.
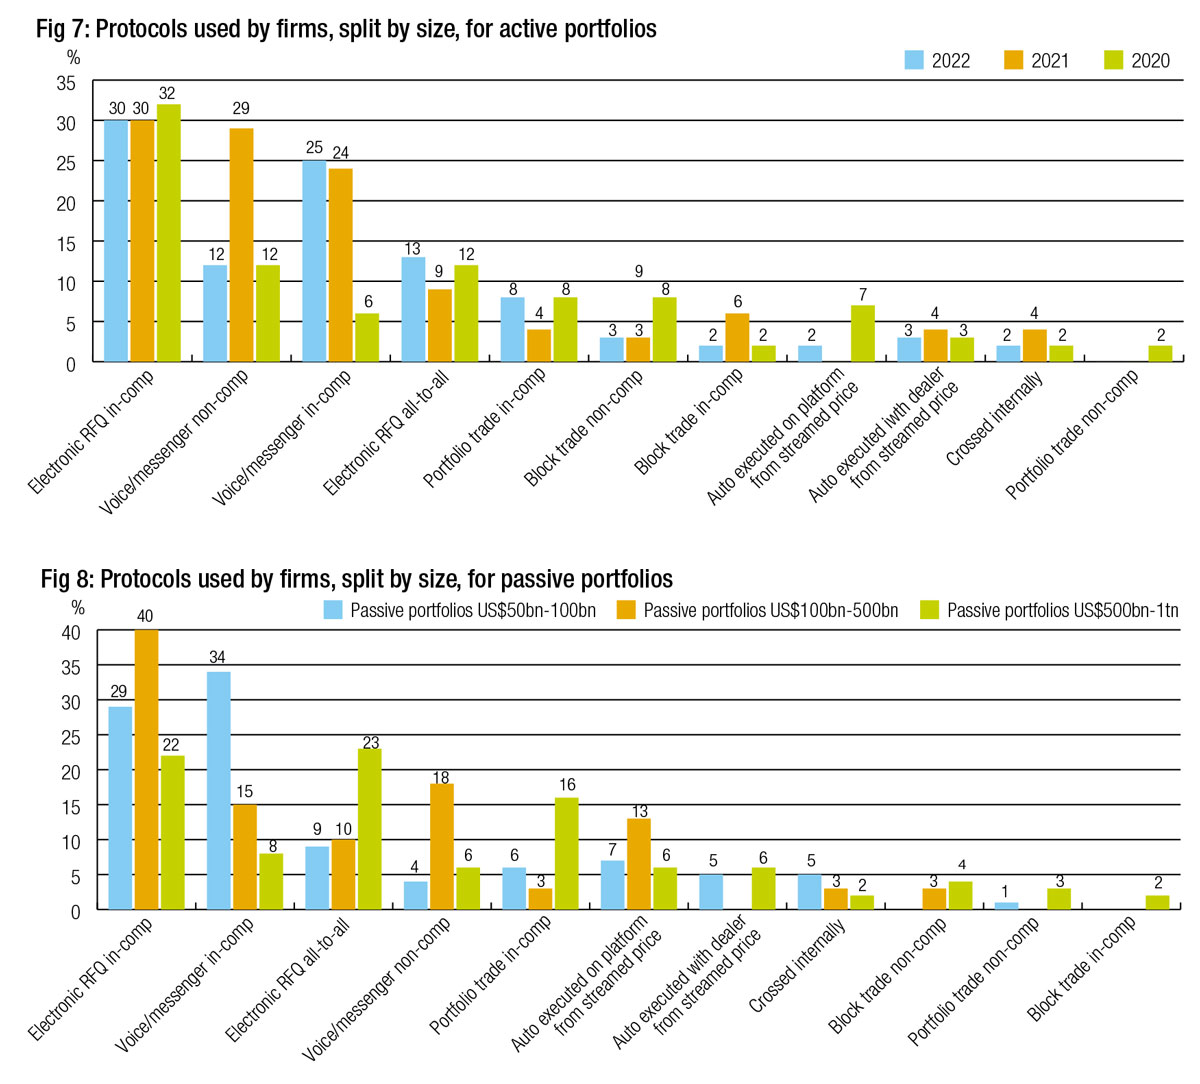
Mid-sized firms are more likely by some margin to trade voice/messaging non-comp for active portfolios, suggesting they are more reliant on dealer relationships to source liquidity than smaller or larger firms.
Passive portfolios are traded for quite differently to active portfolios, but also see a major difference in trading based on the AUM of the firm. For example, larger firms – who are the most numerous providers of passive portfolios – trade via portfolio trades in comp and all-to-all e-trading than they do for active portfolios.
They also engage more with non-comp block trades and auto-execution from dealer streamed prices than other firms, which are both effective at minimising information leakage for very large trades.
Mid-tier firms are making more overall use of voice and messaging in- and non-comp than their peers, although smaller firms also use in-comp voice. They use PT in-comp and all-to-all e-trading less than both smaller and larger firms.
Lower tier firms are still more reliant on electronic RFQ both in comp and all-to-all along with voice in comp than anything else.
The largest segment of firms offering passive portfolio management (Tier 1) are making greater use of dealer relationships and dealer streaming prices than smaller firms, while still using portfolio trading as a major tool.
Mid-tier firms are making more use of all-to-all and internal crossing tools than their large and smaller peers, while the lower tier firms are still more reliant on electronic RFQ than anything else.
Protocol use in US vs EMEA
Looking at the split in trading styles between EMEA and the US, it appears that RFQ in comp is far more commonly used in the US than in EMEA markets, as is all-to-all trading. Portfolio trading is also used far more in the US than in EMEA, while the levels of voice/messaging trading are not significantly different (see Fig 9 and Fig 10).
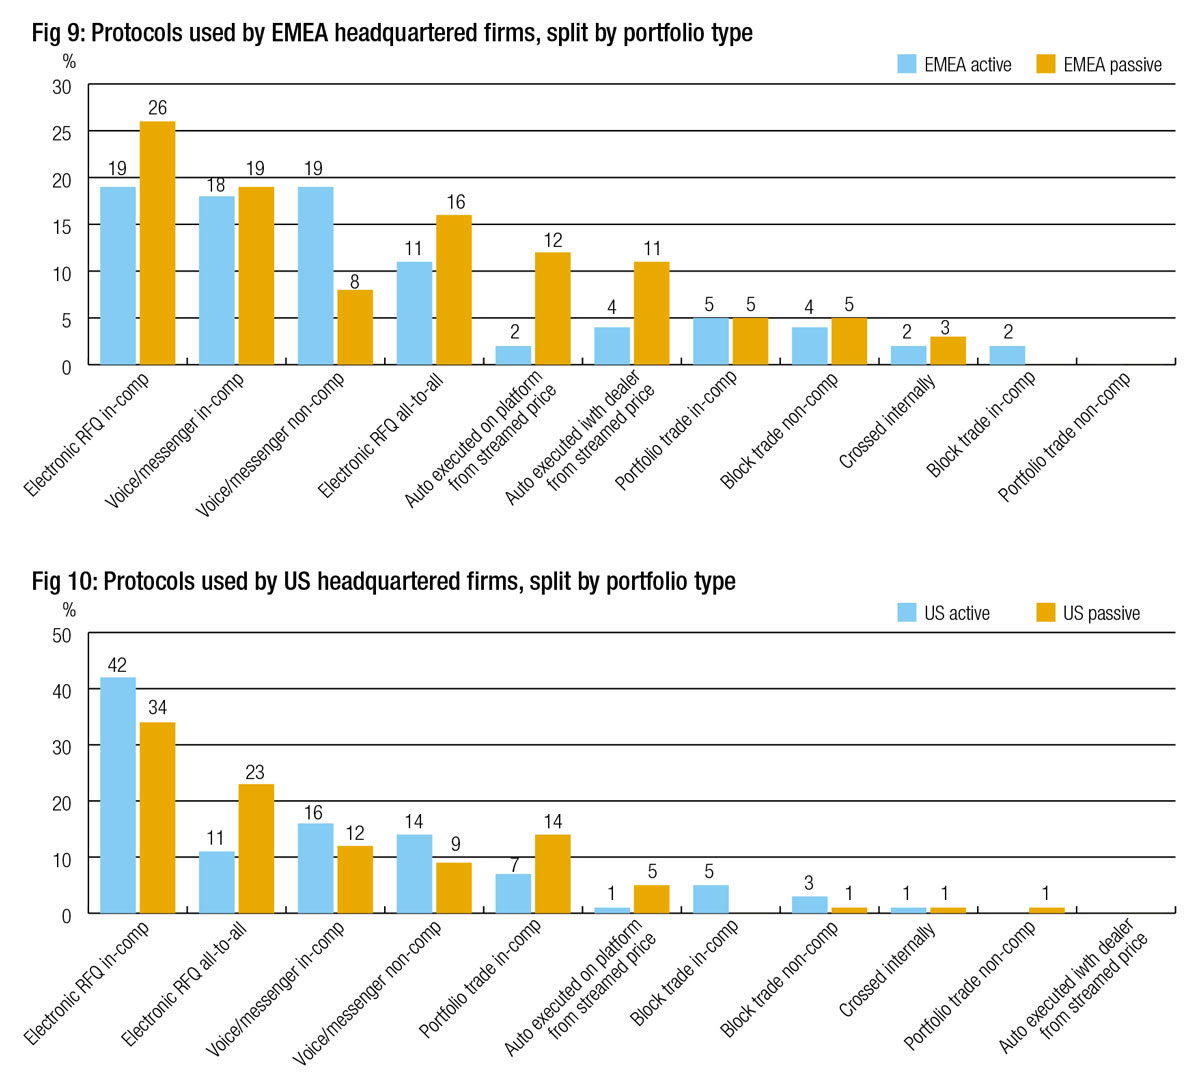
In EMEA auto execution (for passive funds at least) is far more popular than in the US. Internal crossing is naturally more common in the EMEA region – given its borderline illegality in the US – however it is still at low levels overall.
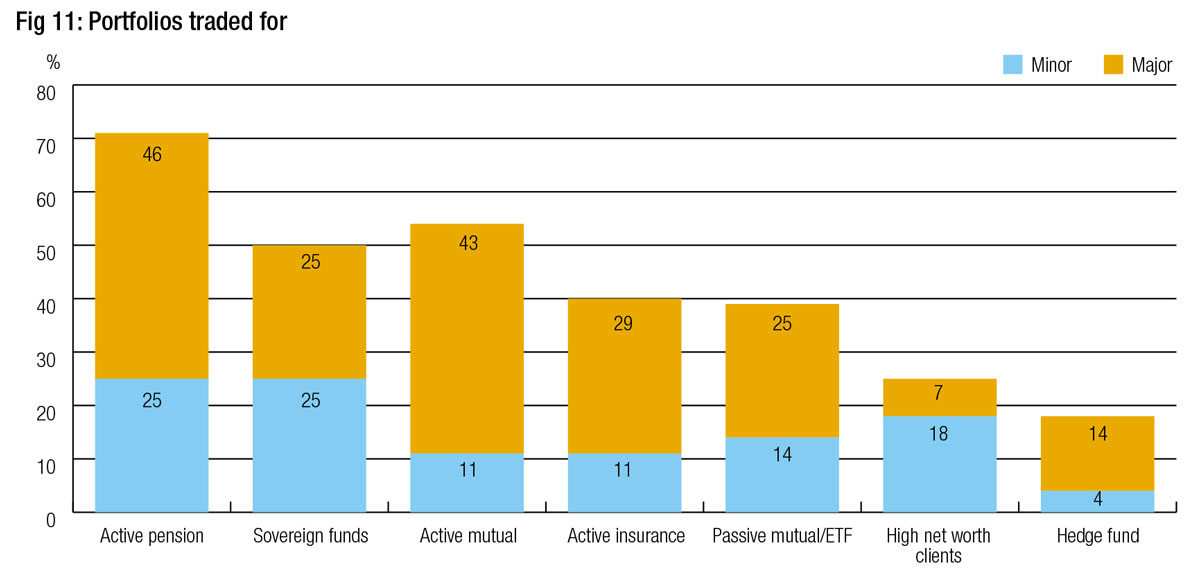
Respondent demographics
The survey respondents were largely headquarter in the EMEA region (50%), with 43% headquartered in the US while 7% were based in APAC.
Most traders worked on behalf of active portfolios, with pension and mutual funds being the most common, while a minority traded for high net worth individuals and hedge funds.
©Markets Media Europe 2025


