


Understanding how challenging the European markets have been to trade this year is far clearer when looking at the numbers. According to MarketAxess TraX data, which tracks trading across multiple markets and counterparties, on trading volumes in European credit, there has been a downward trend in investment grade and high yield, but with such a turbulent trajectory that is could not be described as ‘clear’.
Traditionally secondary market activity does decline throughout the year as firms often issue bonds in the primary market earlier in the year, and that tends to reflect in secondary activity while the bonds are ‘on-the-run’ or still fresh to investors.
A second reason for declining volumes is that market makers take less risk as the year goes on, because they do not want to risk the profits they have already accrued. In 2022 sell-side firms have reported strong secondary market profits, whilst providing very limited liquidity to clients.
Buy-side traders, seeking to manage the market impact of their trades while getting best price and trying to trade as efficiently as the market allows, they need to build a good pre-trade picture of liquidity and pricing.
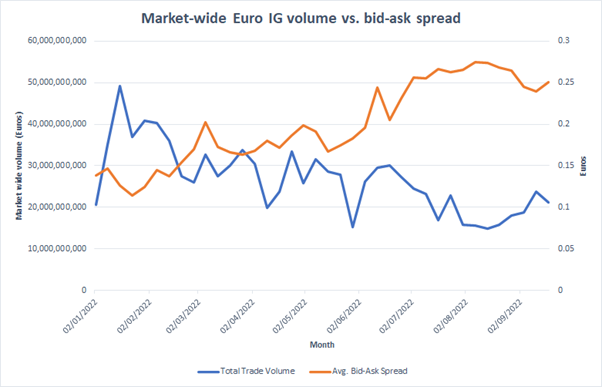
What the data shows is very choppy volumes, but consistently widening bid-ask spreads as the year has progressed, in both HY and IG trading. Although volume is not directly correlated to liquidity – highly directional selling makes it hard to find a buyer – looking at both bid-ask spreads and volume we can see exactly what credit traders in Europe have been fighting through.
Moreover, with macro conditions worsening and dealers less likely to make markets later in the year, it will become even more important that traders are able to triangulate liquidity and pricing pre-trade, making their access to reliable data ever more important.
©Markets Media Europe 2025


 more valuable")


 more valuable")


