



Eurex open interest settled after its spring peak, while CME and Cboe continued to build.
They may still look tiny compared with the gargantuan credit default swap market, but credit futures are here to stay, based on new data compiled by The DESK.
Across the three principal listed markets, open interest remains markedly above year-earlier levels even after the extreme volatility of the spring subsided, while a growing range of contracts is attracting meaningful trading activity.
Source: exchange statistics
The underlying open-interest definitions differ: Eurex and Cboe report month-end positions, while CME reports average daily open interest across the month.
March provided what amounted to the first major stress test for the developing market. As The DESK reported in April, credit futures volumes surged as geopolitical volatility drove a sharp repricing of credit risk and investors adjusted positions ahead of quarterly futures rolls.
READ MORE: Eurex credit futures pass resilience “firm test” in brisk trading
The question five months later is less whether credit futures can trade in a burst of volatility than whether investors continue to hold and use them once that burst has passed.
At Eurex, month-end open interest in euro-denominated credit futures stood at €3.44 billion in August, 55% above the €2.22 billion recorded a year earlier. It was below the €4.55 billion peak reached in April, but had recovered from €2.88 billion in June.
Source: exchange statistics
The composition has broadened as well. Eurex’s FECX investment-grade contract ended August with €2.14 billion of open interest, 21% more than a year earlier. High-yield FEHY open interest reached €1.30 billion, almost three times its August 2025 level.
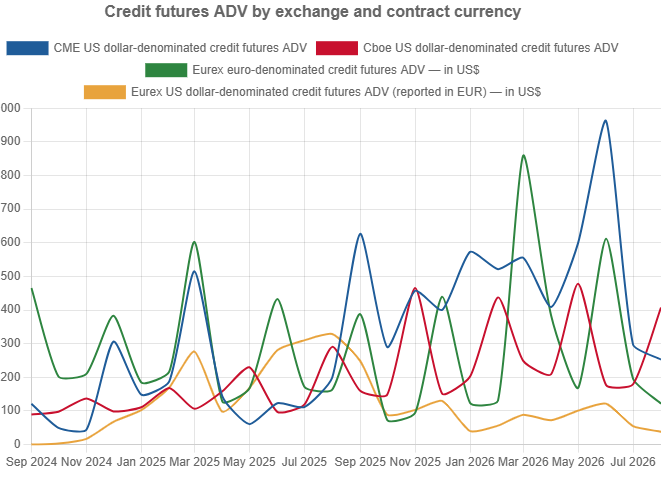
Trading volumes have been more erratic. Euro credit futures ADV fell to €105 million in August after €742 million in March and €530 million in June.
Those peaks need to be treated carefully. Eurex’s March, June, September and December contracts are dominated by the quarterly roll, and the roll itself counts as trading volume. The DESK’s data show those months averaging roughly three times the ADV of non-roll months.
Eurex nevertheless points to broader signs of adoption. The exchange said around 700,000 credit index futures contracts traded during the first half of 2026, representing about €55 billion of notional and taking cumulative volume since launch above three million contracts. It said active end-users exceeded 110, while first-half block volume had already surpassed the whole of 2025.
US futures continue to build
The US-listed markets have also expanded.
CME’s dollar credit futures recorded $253 million of ADV in August, 27% above the $199 million seen a year earlier. Average daily open interest reached $1.61 billion, compared with $472 million in August 2025 — an increase of around 240%.
Cboe had an even stronger August for trading. ADV across its credit futures rose 40% year on year to $407 million, from $291 million, while month-end open interest increased 23% to $2.17 billion.
Source: exchange statistics
The cross-market volume picture is less stable than open interest. CME reached $962 million of ADV in June before dropping below $300 million in July and August, while Cboe moved in the opposite direction in August. Eurex’s dollar-denominated products also now make a visible contribution to overall activity.
The makeup of CME’s business has also changed. Its duration-hedged investment-grade DHB contract accounted for $152 million, or roughly 60%, of CME’s August ADV.
Source: exchange statistics
CME says open interest in its credit complex has exceeded $2 billion on individual trading days. It reported 24 large open-interest holders in HYB and 23 in IQB as of 7 July.
Cboe’s August activity was heavily concentrated in high yield. IBHY generated $258 million of ADV and $1.38 billion of month-end open interest, while IBIG generated $140 million of ADV and $741 million of open interest.
Source: exchange statistics
Cboe described August as IBHY’s third-best month for total notional volume and fourth-best for average daily notional volume, with $5.4 billion trading over the month.
The figures reinforce the impression of a market that is broadening rather than simply replicating one successful contract across exchanges.
The CDS elephant
That said, the listed market is still tiny beside the credit default swap market that institutional investors have traditionally used to transfer credit risk.
CFTC data showed $7.17 trillion of gross credit swap notional outstanding at 28 August, including $4.81 trillion of cleared positions. Against trillions of dollars of swaps, credit-futures open interest measured in low single-digit billions barely registers.
The flow numbers make the gulf equally apparent. New market-facing credit swap transactions totalled $399.7 billion in the week ending 28 August, including $270.3 billion of index and index-tranche activity. North American products accounted for $222.9 billion and European products $162.0 billion.
Across the four reporting weeks ending 7, 14, 21 and 28 August, CFTC credit transaction volume totalled just over $2 trillion.
Even a crude comparison illustrates the disparity. The $222.9 billion of North American swap activity in the final week of August equates to about $44.6 billion per weekday if divided by five. CME and Cboe credit futures together averaged roughly $660 million per day during August.
Complement rather than replacement
However, credit futures and CDS do not provide identical exposures.
Most listed products track cash corporate bond indices, so their returns include both movements in credit spreads and changes in interest rates, whereas CDS indices such as CDX and iTraxx are principally instruments for transferring credit spread risk.
The baskets also differ. CME notes that CDX investment grade contains 125 equally weighted issuers and CDX high yield 100, while its credit futures reference broader Bloomberg cash-bond indices. That can matter for managers hedging actual bond portfolios, where a CDS index may introduce basis risk.
CME’s duration-hedged DHB and DHY products narrow that distinction by using Treasury futures to remove much of the rates component, creating an exposure closer to pure credit spread risk.
Listed futures also fit a different fixed income desk workflow. They can be traded and margined alongside other futures positions and do not require the bilateral documentation typically associated with OTC derivatives.
The case for credit futures is therefore subtler than replacing an old OTC instrument with a modern listed one.
The data instead point to a smaller listed-credit ecosystem developing alongside an enormous and deeply entrenched swaps market — one offering somewhat different exposures, a futures-style workflow and, increasingly, enough liquidity to make those differences useful.
March showed that the contracts could handle a sudden demand for hedging when credit spreads widened sharply. That seems to have convinced users that the market is now here to stay.
©Markets Media Europe 2026