


Looking at MarketAxess data from its TraX service, covering fixed income trading across the corporate bond markets in Europe, the US and emerging markets credit, the most significant change over the past month is the structural recovery in European investment grade (IG) trading, which stands in sharp contrast to continued weakness in both US high yield and emerging markets.
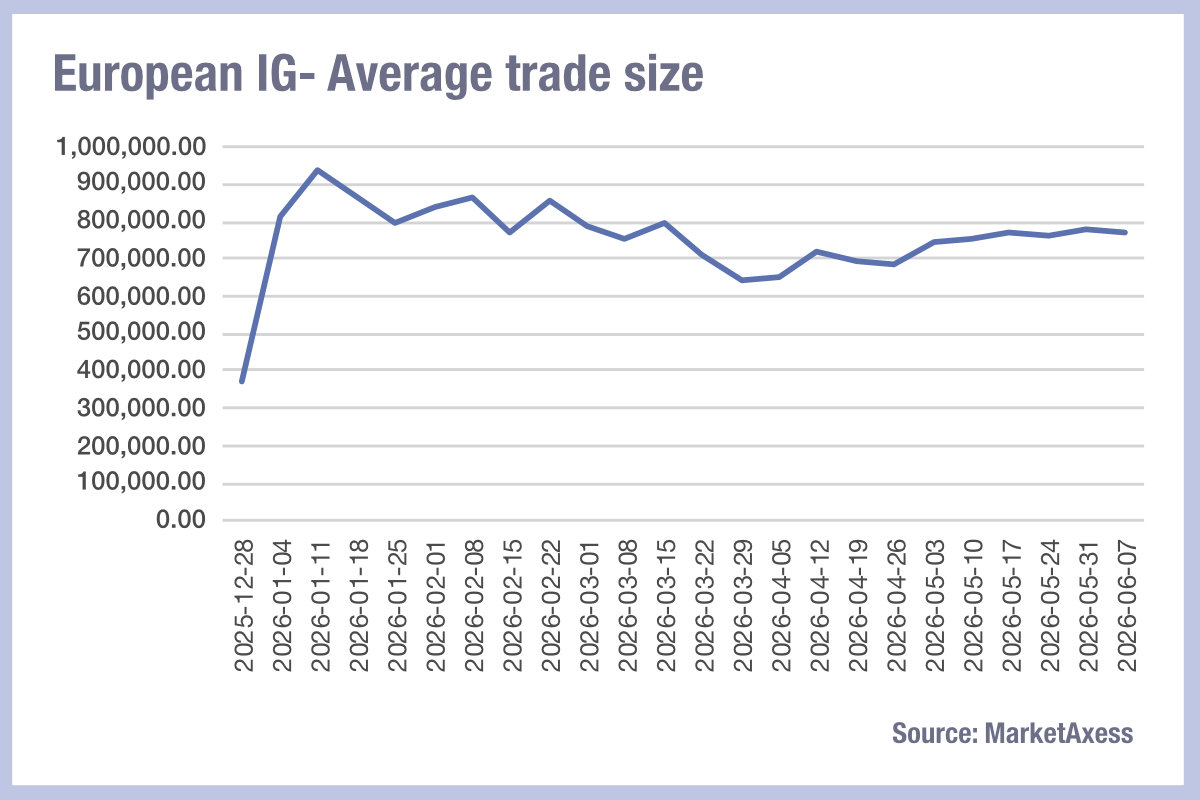
EUR IG has undergone the most material liquidity improvement of any market in our datasets. Average weekly volumes rose from €39.7 billion in the prior period to €47.1 billion, an 18.6% increase, while trade counts climbed 8% and average trade sizes recovered to €767k, up from €698k. Critically, bid-ask spreads, as measured by MarketAxess’s CP+ service, tightened by 19% month-on-month to reach 0.057–0.060 price % of par, their tightest level of the year.
This resolves the divergence that had been the defining feature of EUR IG for most of the year: cost of liquidity has been tightening since April, but availability, measured by the proxy of trade size and volume, had stubbornly lagged. That lag has now closed. The weeks of 17 May and 31 May both delivered over €49 billion and €51 billion respectively, with consistent average trade sizes above €770k. The recovery suggests European credit participants have recalibrated to the ECB’s hold decision and are committing larger positions again.
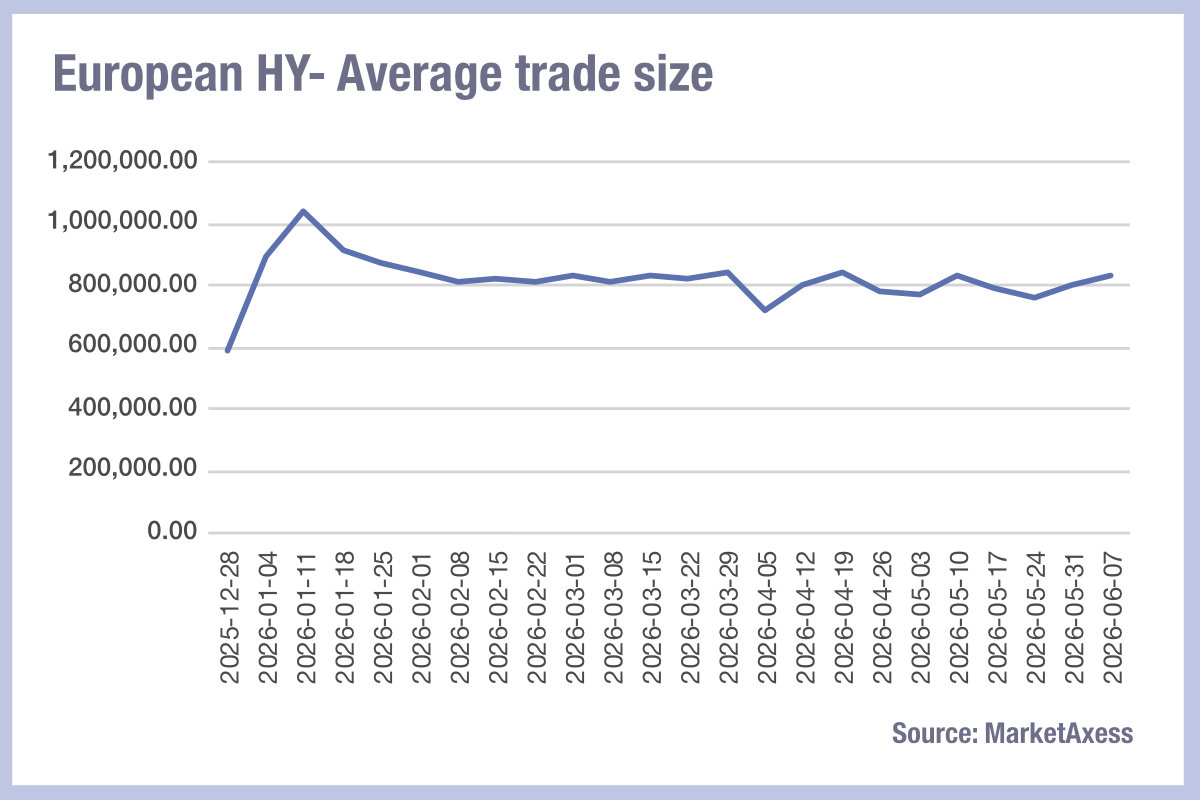
EUR HY liquidity is showing tentative improvement. In the week of 7 Jun, bid-ask spreads averaged 0.21 price % of par, which is the tightest since early April, and the steady widening trend that ran from April through late May appears to have reversed. Average trade sizes edged back to €837k in the latest week. Volumes remain structurally below the Q1 average range of €7–9 billion, but the directional tightening in spreads is meaningful given the previous month’s persistent grind wider.
US HY trading activity has stabilised, but liquidity costs remain volatile. The spike to 0.16 price % of par in the week of 17 May, which was the sharpest single-week move of recent months, has not recurred, and the last three weeks have settled in the 0.13–0.14 range as price % of par. However, average trade sizes have compressed materially, falling from around $823k in the prior period to about $746k in the past month. Weekly volumes are also lower, at $53 billion vs $58.8 billion prior. The market is functioning but at lower throughput, with dealers appearing to quote tighter spreads on smaller clips.
EM saw volumes average $31.5 billion per week over the past month versus $35.8 billion in the month before, a 12% decline. Average trade sizes fell to $1.2 million. The bid-ask spread of 0.19 price % of par in week of 17 May marked a peak, and 31 May offered some relief at 0.173, but in the week of 7 June widened again to 0.183 . The absence of a clear recovery trend, combined with persistently lower trade counts, around 26,000 per week versus the Q1 typical range of 33,000–40,000, suggests that risk perception in EM may be ongoing rather than stabilising, with big blocks being traded to minimise information leakage.
©Markets Media Europe 2025
 more valuable")


 more valuable")


