


It is no surprise that trading costs are higher in high yield (HY) markets, but data from MarketAxess TraX, which measure activity across bond markets and its CP+ pricing tool, show that the volatility of bid-ask spreads can mean only good timing equals a good trade. Unless your dealers can cut you some slack.
US HY trade counts are running right on their January to February average, around 70k per week, confirming the market is active. Yet the cost picture has become sharply volatile. The week of 17 May produced an average bid-ask spread of 0.157%, a jump of 10.5% from the prior week and the highest reading since the March stress period, accompanied by a compression in average trade size to US$684k, the lowest size since March. Then on the week of 24 May they snapped back to 0.13 price % of par (P%oP), the tightest of the year.
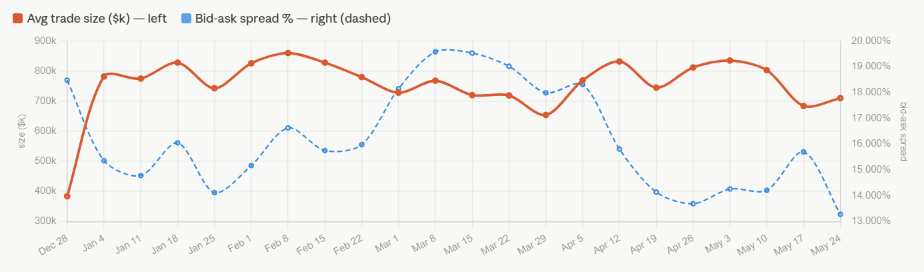
That kind of intra-month spread volatility – 0.137 → 0.157 → 0.133 across three weeks – in a market with stable trade counts is a potential signal of dealer uncertainty. Participants are transacting in volume, but dealers could be repricing event risk into their bid-ask at moments of macro news, such as the narrative around the Warsh Federal Reserve governorship, sticky US inflation, and the ‘Big Beautiful Bill’ fiscal expansion, and are then compressing spread again when the uncertainty clears. Consequently, transaction costs have become unpredictable in a way they were not in January and February. For a buy-side desk, having a way to reach dealers that will minimise their concern around execution risk – such as minimising information leakage, and trading large in size in a small period of time at a size that avoids disclosure – would seem optimal.
EUR HY had spreads at 0.221 P%oP on week of 24 May, back to levels last seen in late March, sitting about 15.4% above the January to February average. This reflects a steady grind higher: 0.213 → 0.215 → 0.218 → 0.221 across the last four weeks. Weekly volumes around €5.4bn and trade counts of around 7,000 are below Q1 averages, but are not collapsing, so the market is still functioning. The pattern is one of investors staying engaged but at a persistently higher cost of entry and exit.
Again, macro reasons, such as the ECB’s potential June hike, are the most plausible driver. With eurozone April inflation at 3% and markets pricing for three potential hikes in 2026, European HY issuers face a fairly sustained risk premium for refinancing debt. We may be seeing that worked directly into bid-ask spreads. The market is in a new, higher-cost equilibrium rather than experiencing a temporary dislocation, and the directionality of the spread trend through May suggests that equilibrium has not yet been reached.
The data demonstrates that costs are not simply higher in HY but more variable and therefore harder to manage. Developing a clear pre-trade picture of who to trade with and how to execute can require additional time and assessment of analytics, but given the vol and costs that can be exposed in HY, selecting the right protocol and counterparty can save considerable value on a trade.
©Markets Media Europe 2025


 more valuable")


