


 Ted Husveth, Managing Director, Credit Product Manager, Tradeweb.
Portfolio trading in credit markets continues to take shape and change the way that many clients are trading corporate bonds. As this protocol continues to evolve, we will highlight significant activity and developments within the space. In this inaugural blog post, initial observations as a result of portfolio trading in the U.S. credit market are presented which sets the table for more in-depth discussions around the evolution of efficiency and liquidity in the future.
Market Size and Growth
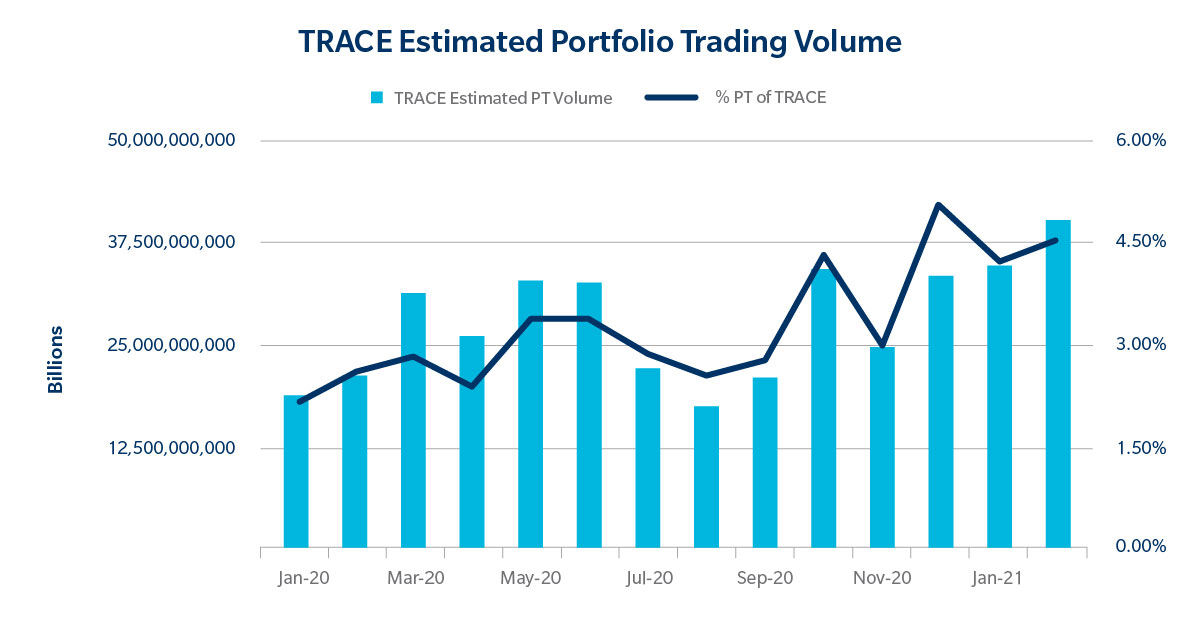
In the U.S., Tradeweb’s Portfolio Trading protocol facilitated $123 billion in 2020 – nearly tripling volumes compared to 2019, demonstrating the vast growth being seen in this segment of the market. So far, 2021 has only continued this upward trajectory with Tradeweb users transacting over $57 billion in Q1. Our inspection of TRACE to gauge the market-wide growth in the use of the protocol estimates that portfolio trades comprised about 5% of TRACE by the end of 2020 up from 2% at the beginning of the year. This growth can be seen across the credit rating spectrum, with estimated total portfolio trading volumes within high yield and investment grade growing at 65% and 40% respectively from 2019 to 2020.
Average-Looking
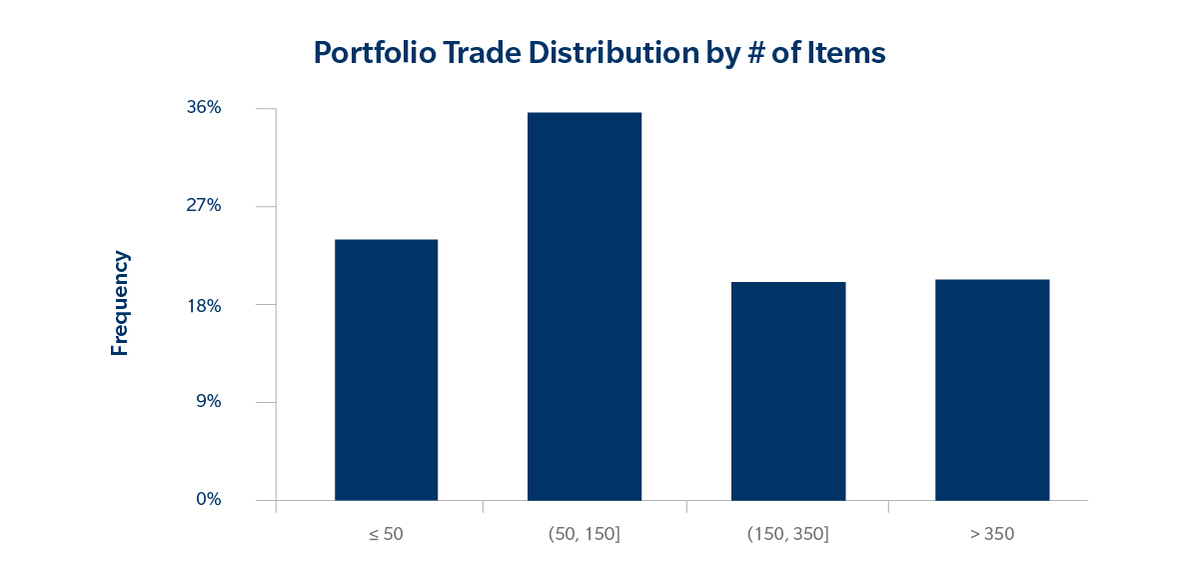
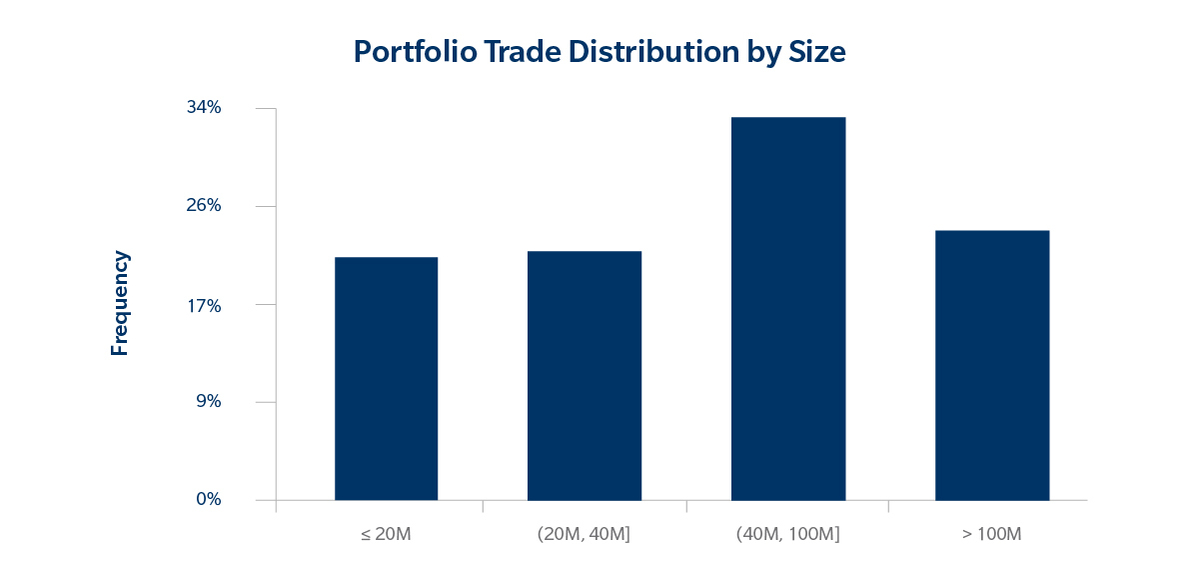
Portfolio trades come in many shapes and sizes. Using H2 2020 Tradeweb data, the average portfolio trade on the Tradeweb platform had a size of $90.2 million with 189 line-items traded. On average, bonds from 16 sectors are traded in a portfolio with an overall split between IG, HY and EM of 78%, 18% and 4%, respectively. The distributions by size and by number of instruments traded are shown below.
Unearthing Liquidity
The average portfolio traded has a Tradeweb volume weighted average liquidity score of 4.43 and an unweighted average liquidity score of 4.02. The liquidity score breakdown of line items traded show that 49% of items have a liquidity score between 1 and 3, 39% between 4 and 7 and 12% between 8 and 10. This highlights the impact of portfolio trading on the marketplace: since the entire basket is being traded, the price of the trade is really capturing the overall portfolio risk. As a result, more illiquid securities can be more easily traded as part of this transfer of risk.
Sum of its Parts
Portfolio trades tend to have both extremely high hit and quote rates. The volume weighted average monthly hit rate at Tradeweb was 92.3% through 2020 and in Q1 this year, the hit rate has been higher at 96.3%. The quote rate (defined in terms of number of items successfully quoted) is at 99% – matching the monthly average through 2020. On top of this, when a client trades, they tend to trade the entire portfolio (on average 3 out of 1000 items don’t trade) and when a dealer quotes, they tend to quote the entire portfolio (on average 1 out of 1000 items don’t get quoted). This highlights once again that clients and dealers are viewing these baskets of bonds as one piece of risk and not on a line-by-line basis.
Drawing Comparisons
Comparing items quoted on a price or spread basis using Tradeweb data from January and February this year, we found that clients had higher hit rates, similar bid-offer spread savings (more on this in a later blog post) and could trade less-liquid items when opting for portfolio trades vs. regular RFQ lists.
With similar to sometimes better execution costs, one of the biggest draws to portfolio trading has been another dimension of execution “quality” – the ability to execute close to 100% of what is desired at the time.
Portfolio Trading |
List Trading |
| Weighted average liquidity score is 4.48 | Weighted average liquidity score is 4.76 |
| Distribution of liquidity scores: 49% 1-3 (Less Liquid); 39% 4-7 (Liquid); 12% 8-10 (Highly Liquid) |
Distribution of liquidity scores: 40% 1-3 (Less Liquid); 47% 4-7 (Liquid); 13% 8-10 (Highly Liquid) |
| Average liquidity score of items in fully executed portfolios is 4.09 vs 4.02 for items in unexecuted portfolios | Average liquidity score for executed items is 4.52 vs 3.33 for unexecuted items |
| Line item capacity: 800 for U.S. Credit | Line item capacity: 150 for U.S. Credit |
| Average # of line items: 179 | Average # of line items: 5 |
In Review
Overall, portfolio trading has shown strong growth across HY and IG through 2020 and continued this trajectory into 2021 so far, with more than $57bn traded at Tradeweb in Q1 this year. Portfolios traded at Tradeweb have exhibited huge diversity across size, number of line items as well as sectors. They have very high hit and quote rates even though the individual line items tend to not be particularly liquid. This emphasizes the strength and robustness of the prices of these baskets of bonds which capture the entire portfolio risk. Stay tuned for our next post, where we will examine portfolio trading market trends.
![]()
[divider_to_top]
©Markets Media Europe 2025


 more valuable")


