


The DESK BENCHmark: Volumes down, efficiency up.
Fewer traders are managing greater volumes of trading in rates, while the volume of electronic trading is increasing across instruments.
The DESK BENCHmark surveys buy-side trading desks to assess the amount of trading that firms’ desks are managing and the way they are processing it. Anecdotally we hear traders are doing more with less. This year the data firmly supports that view.
Volumes are down overall, with average monthly credit trading falling to US$1.6 billion from US$2.5 billion in 2017, and in rates the monthly average falling to US$1.9 billion from US$2.8 billion last year. Supporting that data, traders have confirmed falls of between 30% and 50%. In rates the volume of trading handled per trader has substantially increased since 2016. In credit high levels of electronic trading are not yet leading to a higher trading capacity on the desk.
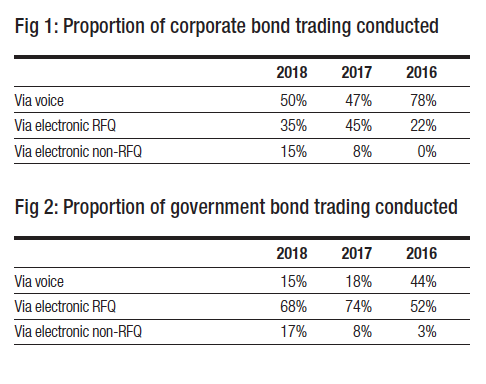
Voice is still more prevalent in trading corporate bonds (see Fig 1) than in the government bond market, where the volume of business has fallen to 15% (see Fig 2) amongst firms surveyed. However credit and rates have seen a significant increase in electronic trading that falls outside of the request for quote (RFQ) model, rising to 15% in credit and 17% in rates.
By dividing the average monthly trading volume for credit and rates by the number of traders handling those instruments, we can see that the volume being processed per trader has increased substantially in some cases, even as volumes overall appear to have fallen.
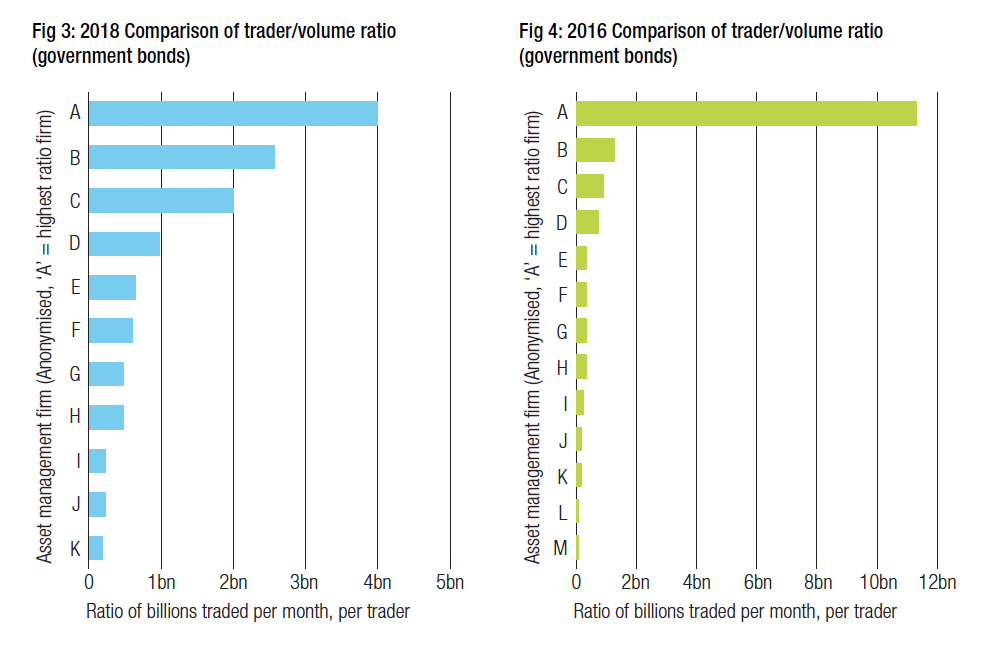
In the government bond space, despite the fall in volumes over that period, the average handled has fallen only slightly from US$1.2 billion to US$1.1 billion per month, but more firms have traders handling over US$1 billion notional per month in 2018 (see Fig 3) than in 2016 (see Fig 4) when just one exception firm traded that level of volume per trader. This all corresponds with the move away from voice trading and towards electronic RFQ and electronic (non-RFQ) trading. The correlation suggests that the increased level of electronic trading is supporting greater efficiency in the rates space for some firms.
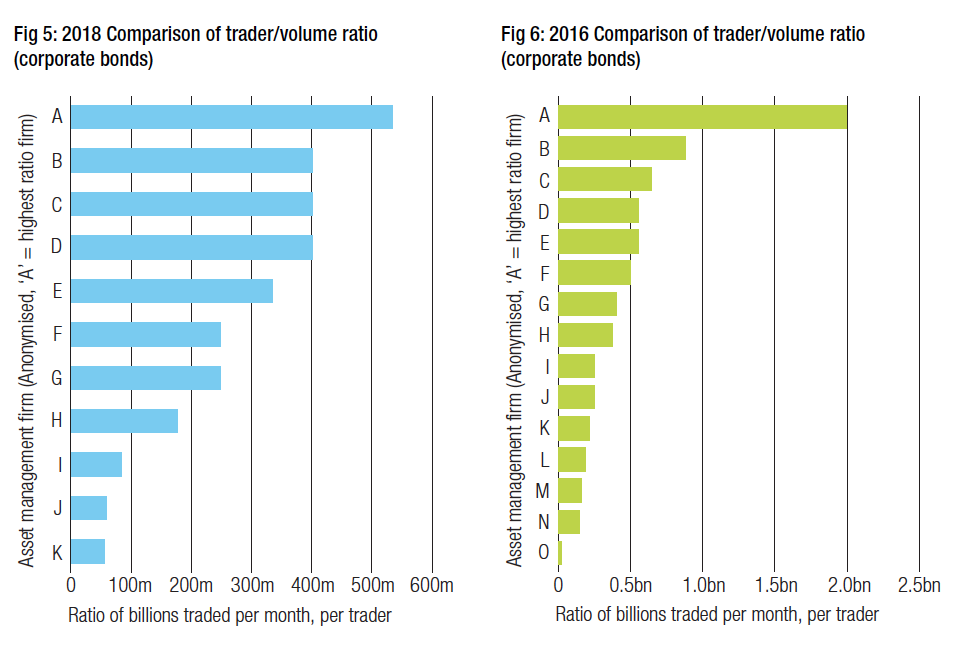
By comparison the credit space has not seen the same changes. Average volume handled has fallen from US$475 million per trader per month to US$267 million in 2016, more closely reflecting lower volume. Considering the smaller sample size providing this data in 2018 (see Fig 5), there is clearly a mid-level of firms where traders handle in the range of US$300k-US$400k of volume a month, much the same mid-level as 2016 (see Fig 6).
Automation of trading in credit can be more challenging, typically because the number of individual issued securities is greater. That reduces the likelihood of buyers and sellers of a specific instrument with the same identifier (ISIN) being in the market at the same time, and as banks are less able to warehouse risk for periods of time getting a match is harder. Nevertheless, the increased use of automation in the sell side is driving up the use of electronic trading channels and that may support greater efficiency in trading over the next 12 months.
While sell-side traders have seen the number of roles in their sector diminishing for some time, the buy side has often been a place where they can put their skills to good use. However, senior buy-side trading roles appear to be reducing with several high profile traders on the market. Merger and acquisition activity is leading to a consolidation of trading teams, and cost pressures are making greater demands of trading desks.
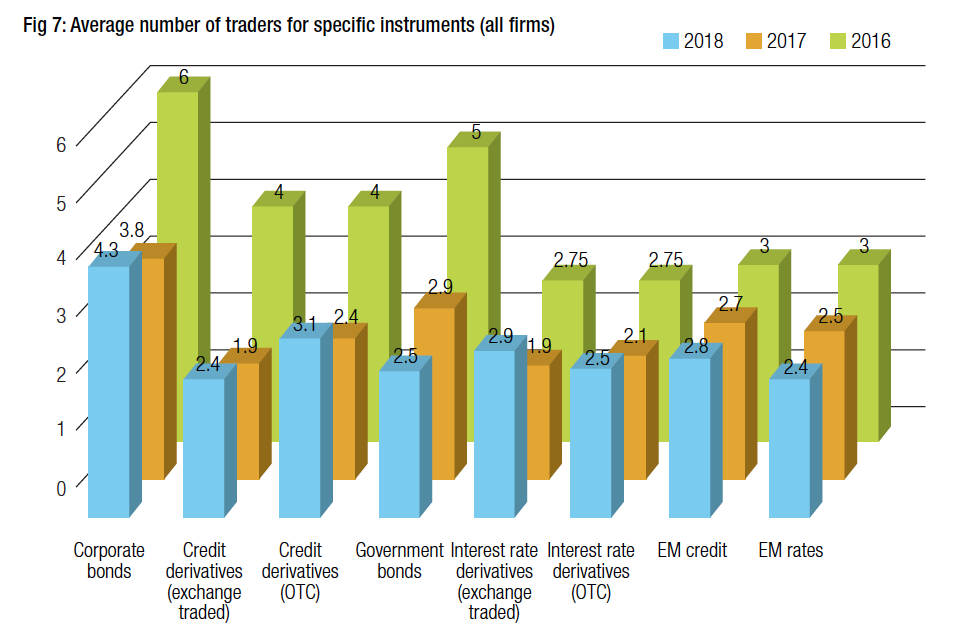
Overall we have seen a reduction of traders handling both corporate bonds and government bonds (see Fig 7), but the latter has more consistently fallen including across emerging markets, indicating a consistent trend rather than variation within a range over time.
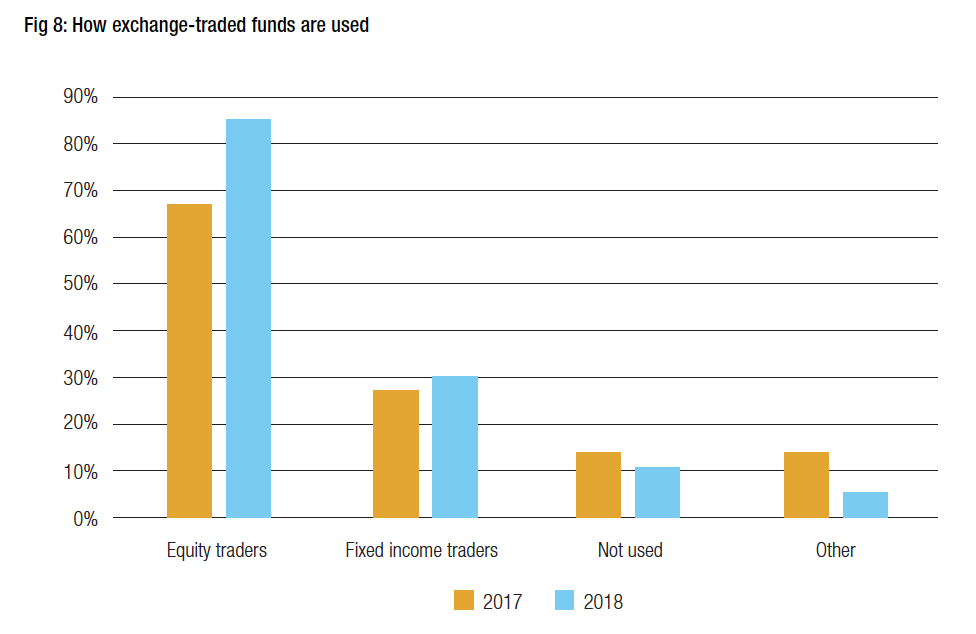
The types of traders using exchange traded funds (ETFs) has also changed over time, with very few using them in 2016, and primarily equity traders having access to them in 2017. Their value as a tool for accessing liquidity has increased, based upon feedback from buy-side traders. The data indicates they are now more widely used by both fixed income traders and equity traders (Fig 8).
Too few firms with significant passive funds contributed to the research this year to draw a meaningful comparison between active and passive operations, which is may also be reflected in the absence of high trading volume outliers.
The wealth of participants fell inbetween the two categories of having US$100bn-449bn in assets under management and US$450+ in AUM, allowing like-for-like comparisons across specific metrics such as broker concentration.
For the first group, broker concentration has increased (see Fig 9), an issue that some expected to arise amongst European firms particularly as MiFID II came into effect. However, the regulation which came into effect on 3 January has had very limited effect on fixed income trading.
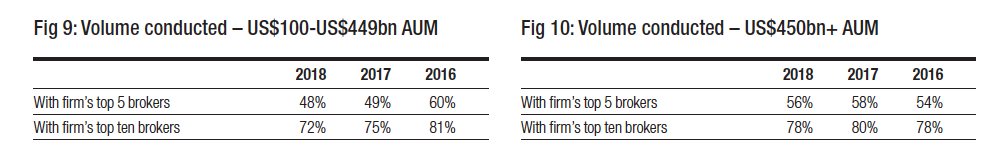
Given that broker concentration has not increased with the group of firms with an AUM of US$450+ billion (see Fig 10), an alternative narrative may be found for mid-sized firms. Where their order flow falls below the size needed to generate effective returns for brokers, which means they miss out on good coverage through trading desks, and yet is above the size that makes electronic trading effective, they may be concentrating order flow with those brokers able to offer better service on a tailored basis, rather than fitting them into a bracket.
Conclusion
The buy-side trading desk is under pressure to become more efficient. That pressure falls more upon some firms and instruments than others. Electronification is clearly making rates traders on both sides of the Atlantic more effective at handling volume, but the credit space has seen little advantage as yet from the many initiatives aimed at better supporting liquidity and price formation.
©Markets Media Europe 2025


 more valuable")


