


This primary research offers traders a view of trading operations within their peer group, to benchmark against their own.
This research is a snapshot of trading operations across 23 institutional investment firms with a total of US$7.5 trillion assets under management (AUM), ranging individually from over US$5 billion to over US$900 billion AUM. The Desk looked at a set of metrics to determine correlation between sizes of firm, levels of activity and trading desk operations. Where categorised by size, the sets of results are grouped by AUM into <US$100 billion, US$100-500 billion and >US$500 billion.
Differences between firms such as levels of passive and active investment, are reflected in trading operations and it should not be assumed that firms are directly comparable. Nevertheless, this study is intended to provide guidance to heads of trading on their own operations against those of other firms.
Contributors to the study are provided with a benchmark report setting their own results against those of their peer group as measured by AUM.
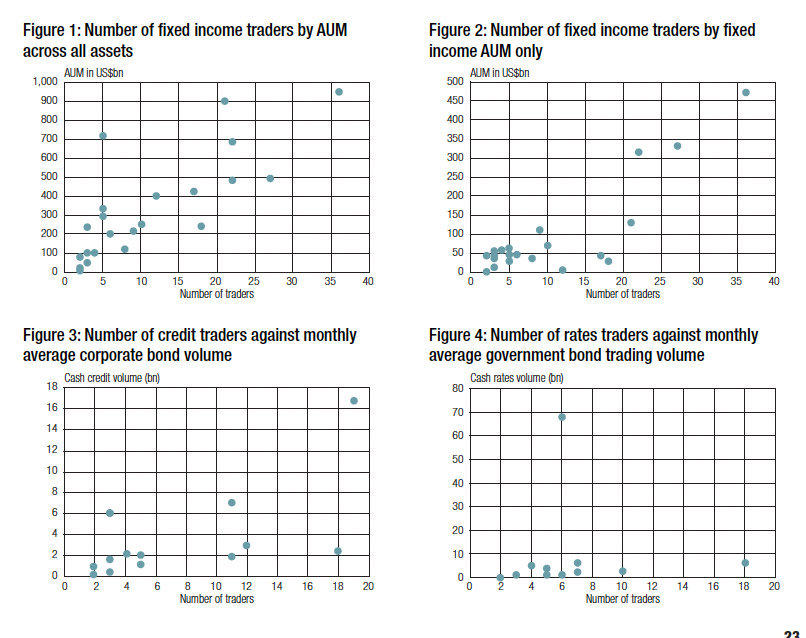
Number of traders
The number of traders working fixed income and cash instruments was clearly correlated positively to the level of assets under management. Looking across firms the correlation is stronger between overall AUM than it is with fixed income AUM (Figs 1 & 2). The number of traders working cash credit instruments also had a closer correlation with monthly corporate bond trading volume than was the case for rates traders and rates volume. Typically the time required in trading rates is greater than in the credit market, with higher levels of electronification. One outstanding desk in Fig 4 was processing around five times the volume that most other desks were handling.
In Fig 5 the comparison between firms of different sizes shows several points of note. Exchange traded funds (ETFs) are not, for the most part, being handled by fixed income traders. Several respondents noted that the equity desks still typically handle trading of these products. The number of cash rates traders has a lower ceiling than exists for cash credit traders, no doubt as a consequence of the more liquid, electronic nature of the rates market. This holds across the interest rates derivatives market as well.
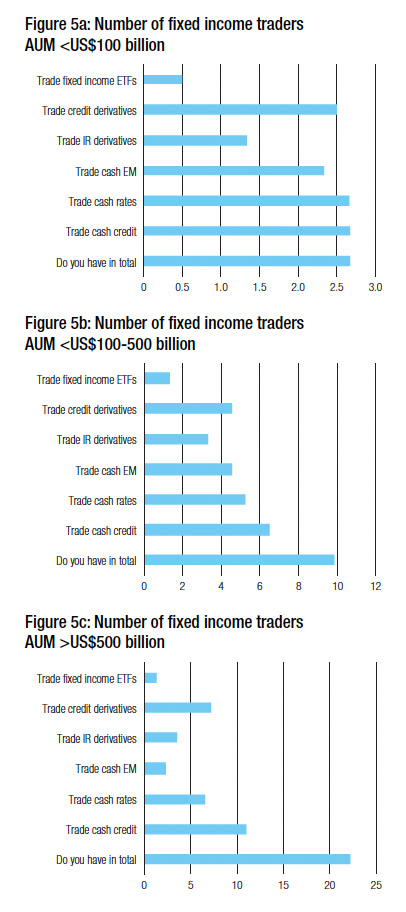
Larger asset managers have the same as or even fewer emerging markets traders than small to medium sized firms.
In identifying the number of funds or accounts traded for (Fig 6), terminology differences between firms led to some uncertainty, so the data here assumes each fund must represent at least one account. Many firms did not or could not separate the number of passive/active funds handled by traders at the larger firms.
For the last chart with firms of >US$500 billion AUM, the paucity of data outside of the ‘total’ result skews the results. However we can see that efficiency in the rates space allows for a high average number of accounts/funds to be handled by traders on the larger firms. The total average number of accounts handled by credit traders is not that different between midsized (42) and large (55) firms given the differences in scale each can be working to. This may reflect a natural barrier rate of efficiency around the 50 account/fund mark at which traders can operate.
The deployment of traders (Fig 7) represents the demographics of the firms as much as their desks. Smaller firms are just as likely to have traders working cross border as they are to trade from on the ground. Medium and large firms with a focus on European and US markets have European and US-based operations with a greater proportion of traders in those locations trading EM.
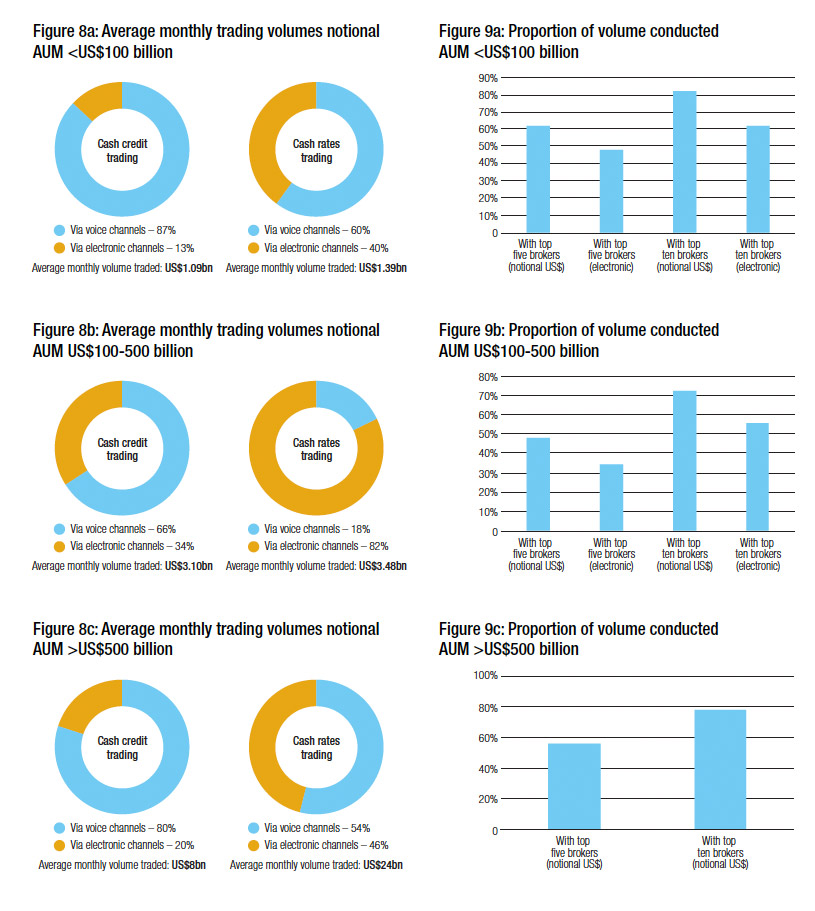
The difference in electronic trading rates between the smaller firms and the largest firms is considerable (Fig 8). That may mean there are potential efficiency gains to be had through greater use of electronic channels by smaller firms. At both medium and larger firms the level of rates trading is higher via electronic channels than voice.
As a side note, many firms did not separate out their electronic vs voice trading rates – 40% of large firms, 25% of medium sized firms and 20% of smaller firms – with many saying they were not able to, rather than unwilling to.
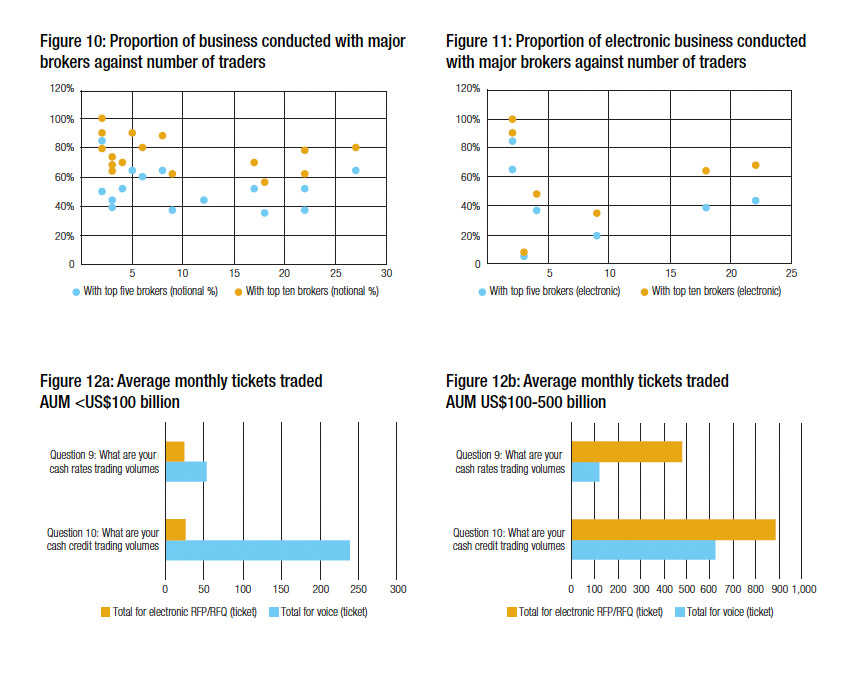
The levels of activity traded (Fig 9) with top five and top ten brokers are reasonably consistent across the sizes of firm, although medium-sized asset managers are liable to put less trade via their main broker partners than smaller or larger firms. If we look at the full range of respondents, overall distribution of concentration with both top five and top ten brokers vs number of traders suggests a slightly negative relationship for both.
Although there was less data to use, one can see a smile distribution pattern for the concentration of brokers for electronic business against number of traders (Fig 11).
By contrast the average number of tickets traded per month (Fig 12) is considerably different between small and medium firms (firms in the >US$500 billion bracket declined to provide data), with a far higher number issued electronically by medium-sized firms, reflecting the smaller sizes traded electronically, than by smaller firms who, based on reported trading volumes, have not embraced electronic trading to the same degree.
Conclusion
The drive towards efficient trading – being able to point trading resource at more complex orders and instruments – is being achieved at very different levels across the industry. Seeing the potential that a desk can achieve could drive traders towards exploring new ways of working, new skill sets and new operating models in order to optimise their own performance.
©Markets Media Europe 2025


 more valuable")


