


Market data solutions provider, BondCliQ, will be launching a dynamic weekly report which aggregates and analyses data on US portfolio trading (PT) from TRACE, bringing it into a usable format for traders on the buy and sell-side. From 15 May, 2023, FINRA members must report transactions in TRACE Corporate securities which are part of a portfolio trade with an appropriate modifier.

“While TRACE requires trades to be tagged if they are part of a PT, none of that information is aggregated for people to quickly comprehend and also allow sifting for deeper insight,” says Kevin Molloy, head of data sales at BondCliQ. “To help them see how much portfolio trading took place we are including aggregated and granular information on PT activity within our reports and solutions.”
The firm has already found that reported volumes have a more nuanced make-up than had previously been considered, which may change understanding of the business.
“From a trading perspective we’re talking about 5-6% of average daily volume, but every single day, we see roughly 20% of that are dealer to dealer trades,” he notes. “Should we consider that portfolio trading volume, or is it just a pass through from one dealer to another with the customer relationship? Does that mean ADV is really 3% or 4%? That’s something our reports allow the user to explore more.”
Adding a greater assessment of the impact that portfolio trading has to market activity is valuable to traders as trades affect their own positions, pricing and potentially engagement in PT activity themselves.

“Tracking portfolio trades is not something that is well done now,” says Robert Simnick, senior fixed income trader & credit portfolio trade specialist at Invesco. “Having the ability to see tactical and strategic moves through portfolio trades is important.”
BondCliQ’s solution is designed to deliver weekly assessments but can also support more bespoke levels of information, including real-time insights.
“It’s shining a lot of light on volumes, trade flows and how trades are conducted, be that straight dealer buying or selling to a customer, rebalancing by buying and selling within that portfolio, or the potential involvement of some non-customer facing market makers that are that are working with the dealers to get portfolio trades executed,” says Molloy.
By tuning in to what customers are looking for on a more bespoke basis, BondCliQ plans to support teams working across the trading workflow. Assessing the level of trades hitting the tape within a few seconds, it can provide awareness of the size and pricing of individual trades to support the assessment of value.
“We can inform people better about what’s happening in the marketplace, where and why spreads are widening or tightening,” Molloy adds. “We can provide you with a methodology either canned or bespoke to analyse the data.”
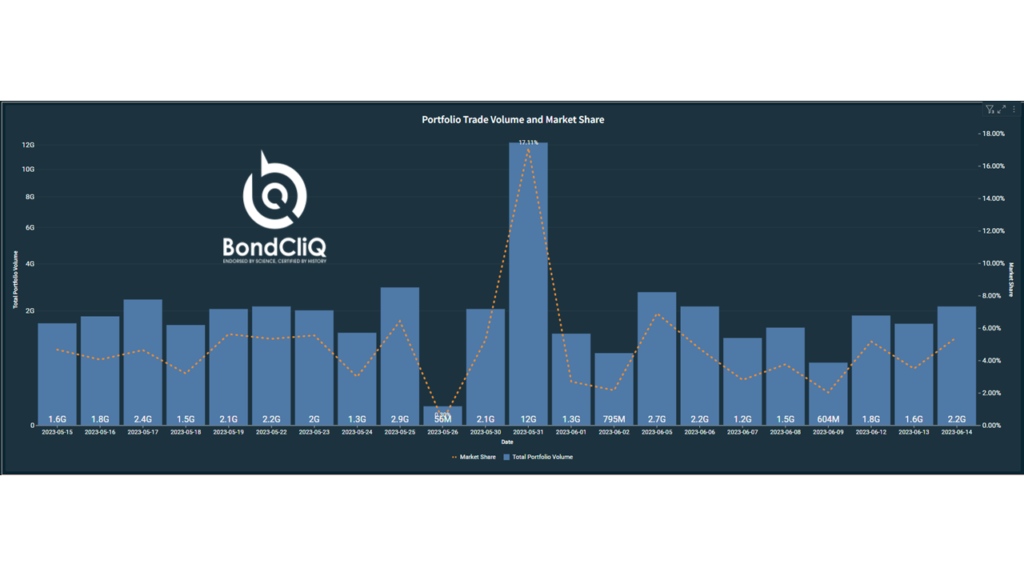
Looking at the proportion of volume traded via PT, it is clear that there is a significant spike at month end, making up 17% of overall volume on 31 May, for example. It is also possible to see when these were printed, typically when futures or equity markets closed.
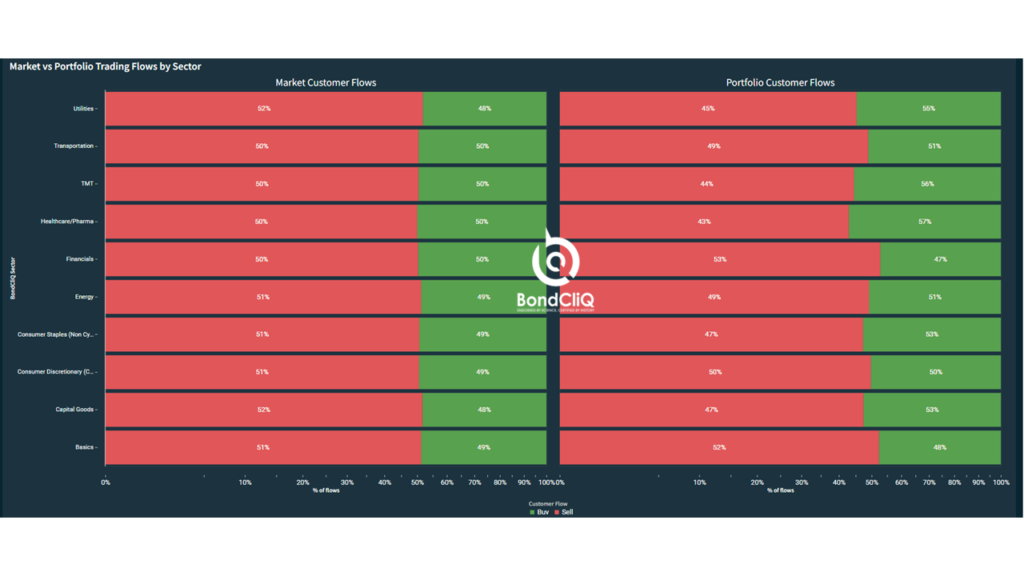
The system provides an analysis of both overall market and individual portfolio trades by sectors, maturity buckets, ratings and counterparty types to work out who is buying and selling, plus where they are conducting that activity in the market.
“If we think about it from the front office, people want to know what just hit the tape because it might even out over the week, but if you have a trade that’s heavily TMT weighted, or someone is rotating out of BBBs into BBs, those are things you want to know right away,” he says. “That can skew your position for the next couple of hours.”
With worsening credit conditions and industries likely to experience tightening at different points, an understanding of when moves occur, notably in illiquid markets, could prove very fruitful.
The BondCliQ analysis not only shows where PT is being used and for which bonds, but by assessing the direction of trading between buy and sell-side counterparties, it also allows dealers and investment traders to work out where they are most likely to see liquidity provision.
Sign up for the weekly report here for free.
©Markets Media Europe 2023

©Markets Media Europe 2025


 more valuable")


