


Comparing portfolio trading and list RFQ TCA
By Gio Accurso, Grant Lowensohn and Jessica Hung, MarketAxess
Highlights and objectives
- The MarketAxess Research team investigates any key drivers of Portfolio Trading (PT) Trading Cost Analysis (TCA) outcomes, as measured by PT price outcomes versus CP+TM side.
- An analysis of PT features found no meaningful driver of TCA outcomes for PTs across ETF overlap and Liquidity Profile.
- There is a strong correlation, however, between PT TCA and ETF premium discount, likely driven by dealer positioning and risk management.
- We also compare this key driver with TCA outcomes of List RFQ and found this is a stronger driver of PT performance than for List RFQ.
Portfolio Trading, where a basket of bonds is traded on an all-or-nothing basis at a volume- weighted price, has emerged as an increasingly important protocol in the corporate bond market.
In September 2023, PT market share on TRACE in High Grade reached an estimated 5.55% of traded volume. Although PT offers certainty of execution and can complete large orders with many line items, it is still critical to ascertain the execution quality increased. To measure TCA, we compare the execution level(s) against side-dependent CP+, our award-winning, AI-powered pricing engine. A client buying at a price below the bid or selling above the offer price would indicate outperformance of the benchmark. Using this, we compare pre-trade analytics that have a strong correlation to positive or negative TCA in PT and RFQ lists.
Methodology
To perform this analysis, we looked at PT trades from June 2022 to June 2023 on MarketAxess where High Grade bonds represent a majority of the basket. We filtered for PTs that have at least 2 unique bonds, minimum number of 2 dealers invited, a minimum of 5 line items, and a minimum total size of $1 million. We apply the same filters for RFQ lists in the below charts. The typical PT on the platform has 115 line items, has a median total size of $29.1 million and an average Relative Liquidity Score of 7.07. In comparison, the typical list has 26 line items, has a median total size of $4.3 million and an average Relative Liquidity Score of 7.04.
Weak relationship between Portfolio Trading features and TCA
Due to the basket nature and diversification of a PT, we can look at the characteristics of a PT and observe if there is any correlation with its TCA outcome. For this exercise, we looked at two PT characteristics – ETF overlap and Average Liquidity Score (see Figs 1 & 2).
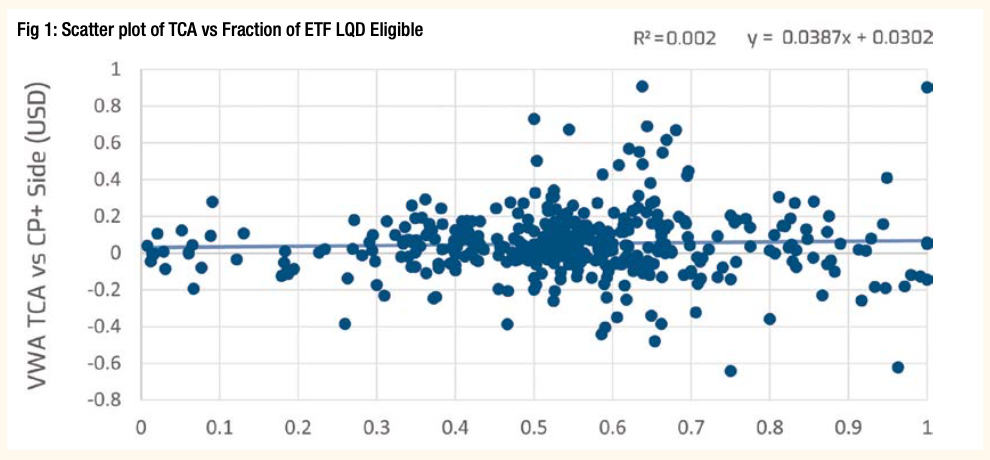
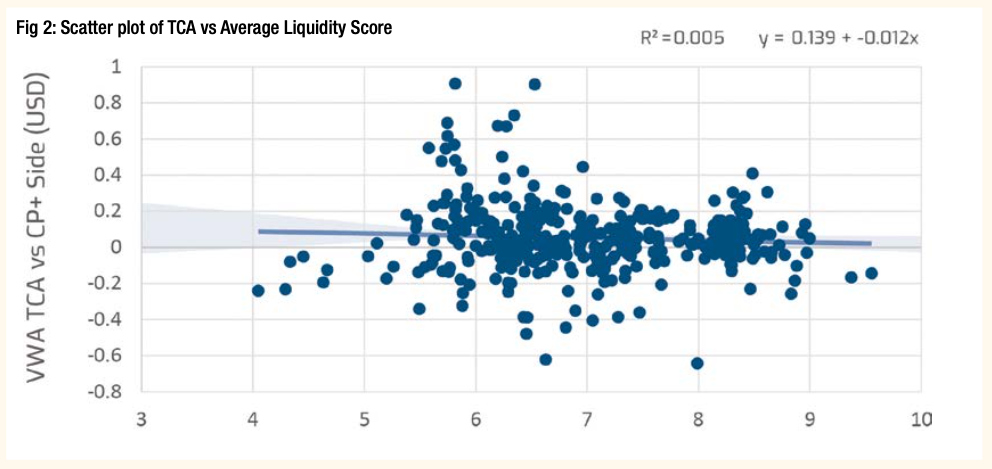
In the above graphs, we measure a PT characteristic and plotted it against its corresponding Volume Weighted Average TCA against CP+ on the same side. We can see that both characteristics lack a strong correlation with PT TCA, meaning that neither are a driver of TCA outcomes.
ETF premium discount and TCA
Since PTs can execute many line items in a single transaction, one likely usage of PT is to trade baskets that mirror existing indexes. The rise of electronification among passive investment in the corporate bond market has provided a large sample size to test the relationship between ETF characteristics and TCA. We use our CP+ pricing tick data to calculate the value of the LQD ETF constituents. Similar to the above, when the
ETF price is higher than the CP+ Offer for these constituents, the ETF is trading at a premium. Conversely, when the ETF price is cheaper than CP+ Bid for the constituent bonds, it trades at a discount. We calculate this for each trade date and hour.
Premium/Discount = Avg (ETF Stock price – CP+ Side)
We explore deeper into ETF arbitrage and inquiry volume skewness in this article*.
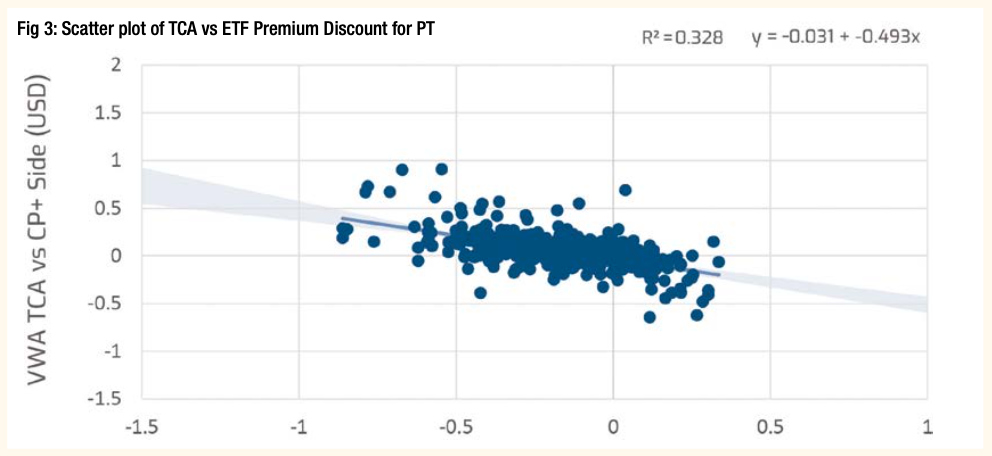
Fig 3 presents each PT’s execution quality vs LQD’s prem/discount for client trades over the stated period. We can see that clients receive better TCA outcomes when the ETF is ‘cheap’ compared to the underlying bonds (negative x-axis), meaning that the market is working efficiently to perform ETF arbitrage.
Similarly, we can analyse the effect of ETF Premium Discount on TCA outcome on List RFQs.
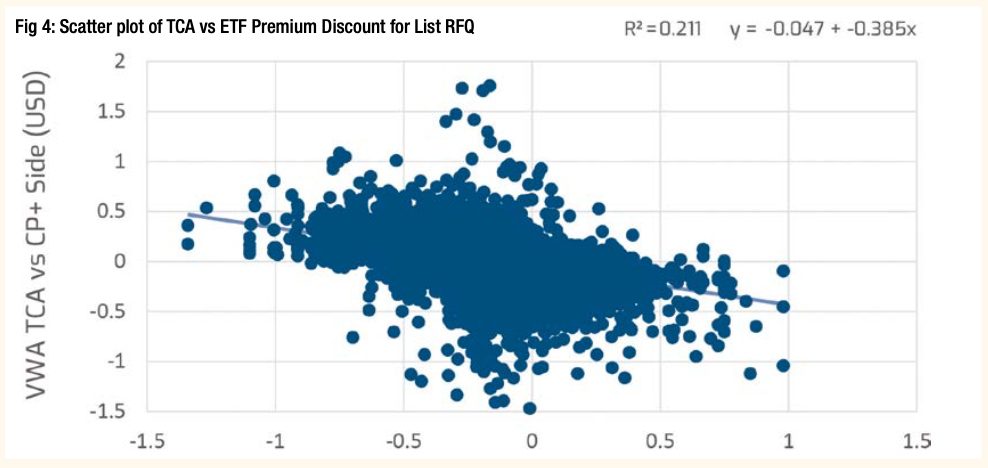
(Fig 4). We observe a similar trend, such that TCA outcomes are better when the corresponding ETF is trading at a discount. However, compared to the trendline of PT TCA, the trendline for List RFQs is not as steep (0.493 vs 0.385). From this we can infer that List RFQ TCA is a result of how dealers price and manage risk in single line items, whereas in PTs risk is managed at the basket level; this further demonstrates why ETFs are a more suitable hedging instrument for PT risk management.
![]()
The above is the conclusion of a three-part series that explores the benefits of trading larger block sizes electronically, and how MarketAxess tools and protocols are being developed to help optimise execution regardless of size, side, and timing. Earlier pieces on examining market impact of client inquiries and pre-trade intelligence can
be found by visiting www.marketaxess.com/knowledge
For questions or follow-up, email MarketAxess data scientists: research@marketaxess.com
*www.marketaxess.com/article/etf-arbitrage-and-inquiry-volume-skewness
©Markets Media Europe 2025


 more valuable")


