


In the past quarter, the average daily notional traded for US Treasuries was 99.5% of the total value of securities issued in the same period, emphasising how highly liquid a market it is.
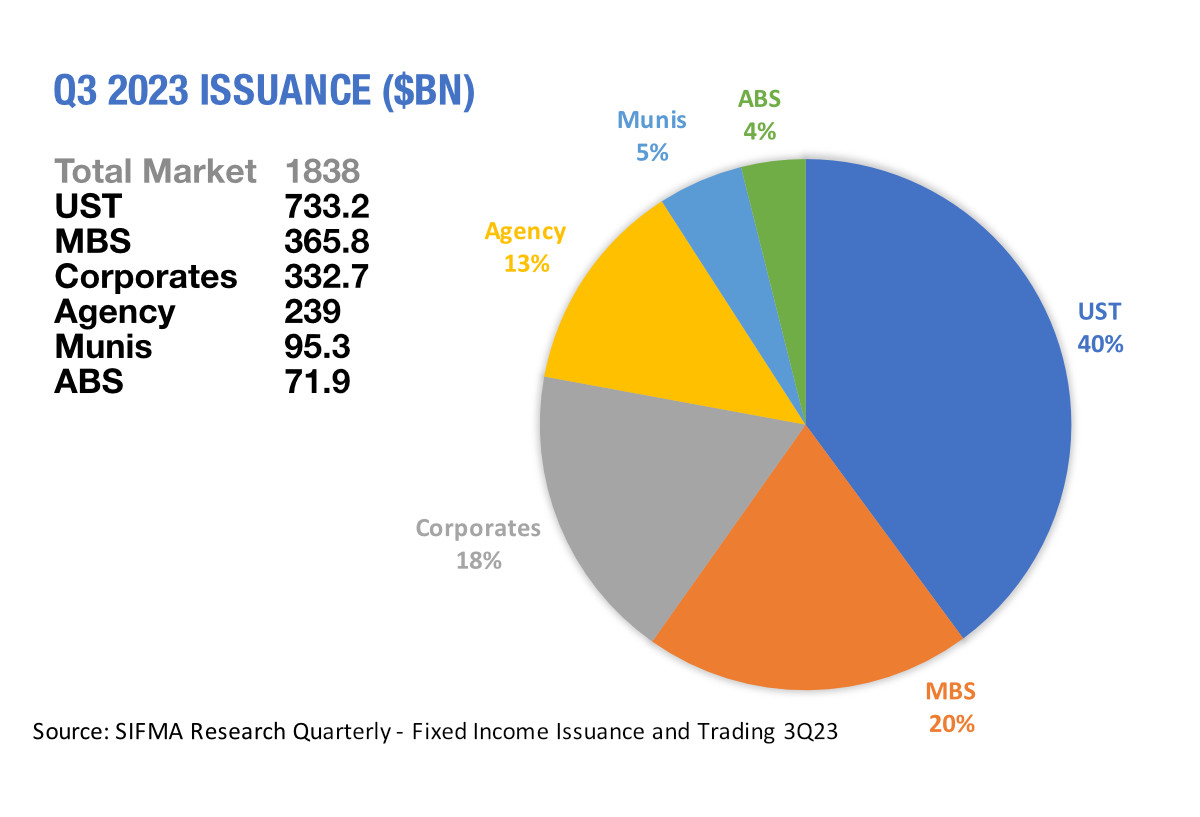
The latest quarterly update on US fixed income markets from the Securities Industry and Financial Markets Association (SIFMA) gives a clear picture of the differences in liquidity between segments of the debt markets. Looking at the issuance of debt in different classes, and then correlating that with the average daily volume in notional traded for each type of debt, we get some stark contrasts.
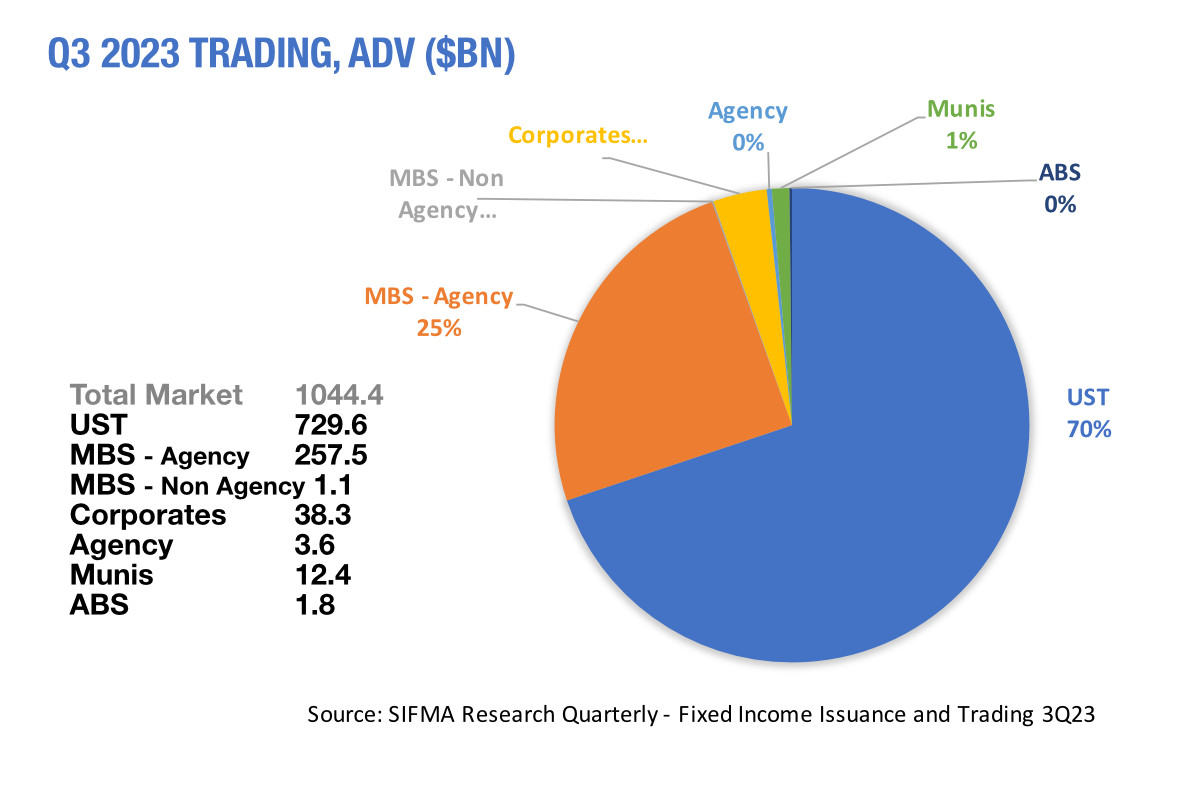
In total, the volume of issued debt traded daily was 56.8%. However, this is highly skewed by the Treasuries market and the second most liquid section, mortgage back securities (MBS).
The ratio of ADV to issuance for MBS was 70.7% Municipal and corporate bonds are far less liquid, based on the ratio of trading activity to issuance.
Munis, the more relatively active of the two see 13% of their issued value traded on a daily notional basis.
For credit, this falls to 11.5%. That is within the typical range for corporate debt, which saw 10.4% in Q2 2023 and 12.3% in Q3 2023 by way of comparison.
The very least liquid instruments based on the issuance versus ADV are agency debt and asset backed securities (ABS) with a ratio of 1.5% and 2.5% respectively.
While liquidity can be measured by different metrics, having an understanding of the turnover of issued debt is clearly one broad indicator, however traders will need to have a decent pre-trade understanding of liquidity through detailed metrics on a daily basis.
Unless counterparties are offering firm prices and sizes, liquidity can be illusory.
©Markets Media Europe 2023
©Markets Media Europe 2025


 more valuable")


