


Mid-sized asset managers champion electronic trading – The DESK’s BENCHmark research has found mid-sized firms use electronic trading and a wider range of brokers than either smaller or Tier 1 firms.
For the second year, The DESK’s primary research into buy-side trading desks has found that firms with assets under management (AUM) of between US$100 billion to US$450 billion exhibit the greatest level of non-RFQ electronic trading, and concentrate less fixed income trading volume through their top five and top ten brokers.
Having surveyed 20 major investment managers from retirement funds to asset managers, the BENCHmark has found consistent patterns across their trading functions.
Trader ratios
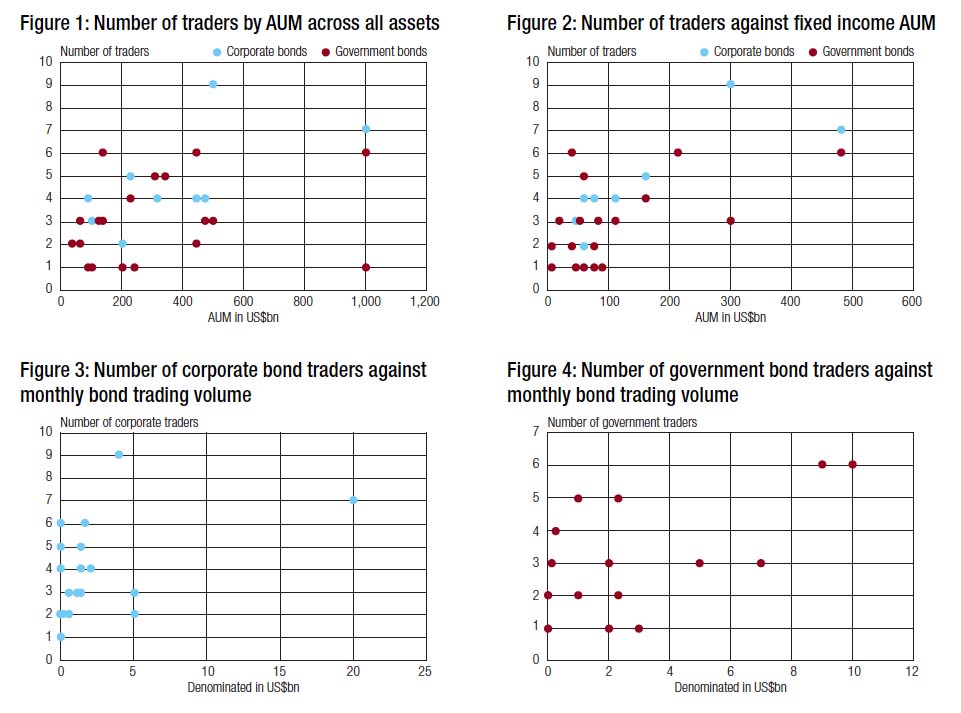
The number of credit and rates traders was again positively correlated to the overall level of AUM (Fig 1 & 2), and there was a positive ratio for both corporate bond traders to volume and government bond traders to volume (Fig 3 & 4).
Trading activity in the rates space varies considerably by country – US Treasuries are highly automated while many others have a higher proportion of voice trading. Within credit, the level of activity varies across investment grade (IG) and high yield (HY), with numerous electronic platforms operating in IG. Consequently there are factors that can increase the need for high-touch trading in both rates and credit markets.
Traded instruments
Exchange traded funds (ETFs) were used by 80% of firms, with 45% of asset managers trading them on their fixed income teams while 30% only traded ETFs on their equity desks. Five percent of firms traded ETFs on their fund-of-funds team.
The average number of traders employed was for the most part positively correlated with size of firm based on AUM. Firms with less than US$100 billion AUM typically have one to two traders covering any set of instruments. Mid-sized firms with between US$100 billion to US$449 billion average three traders for cash instruments and two for derivatives. Larger asset managers with US$450+ billion AUM expand out to four traders for government bonds.
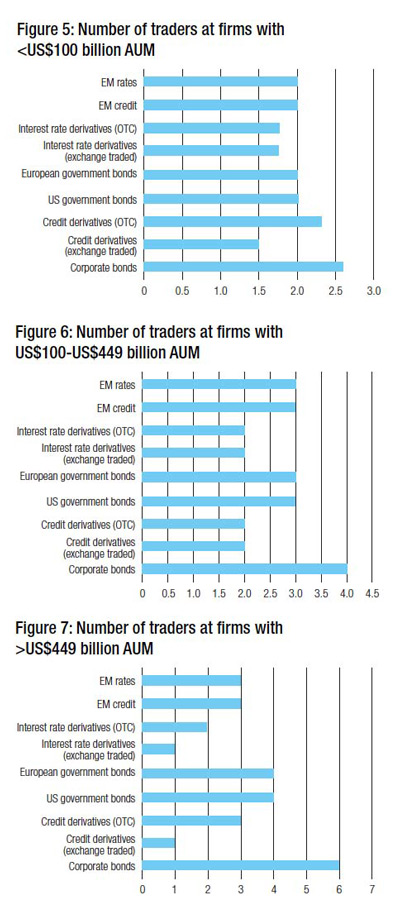
The one instrument that consistently requires a larger number of traders to handle is corporate bonds; this is unsurprising given the range of industry sectors, geographies and credit qualities that it covers.
Passive vs Active
Due to the relatively smaller average number of passive funds that traders work for (Fig 8 & 9), it is hard to draw a direct comparison with the number employed to trade for active funds. However it is clear that a single trader is trusted by firms to work on up to 30 passive funds where two traders are employed for the same number of active funds. Clearly fund size and portfolio composition has a bearing upon the complexity of trading, but equally rebalancing passive funds requires less debate than making changes to active funds.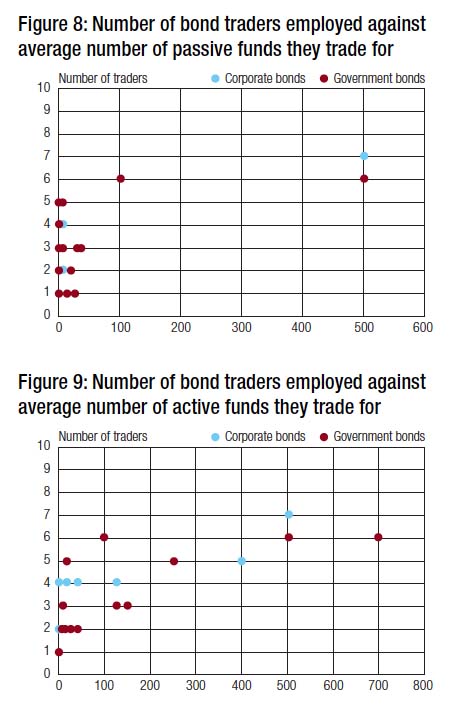
Size of firm vs activity
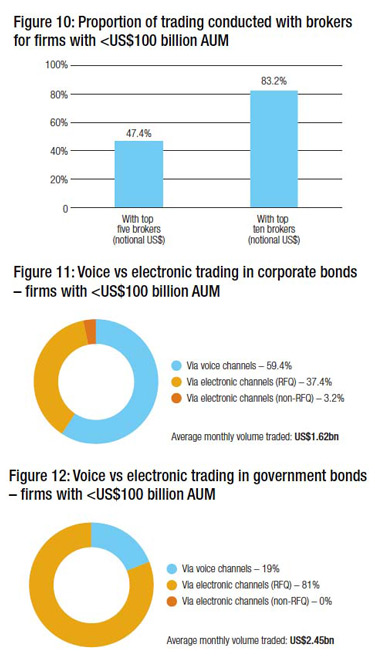
Amongst the smaller firms, voice trading is dominant for the corporate bond market (Fig 10) but RFQ trading is largely used for government bond markets. Just less than half of trading volume is run across the firms’ largest five brokers, however the top ten brokers capture the vast majority of trading volume (Fig 9).
Mid-tier firms run slightly closer to half of their trading across their top five brokers, but just three quarters of trading volume by their top ten dealers, implying a greater diversity of trading partners than are used by smaller firms (Fig 12).
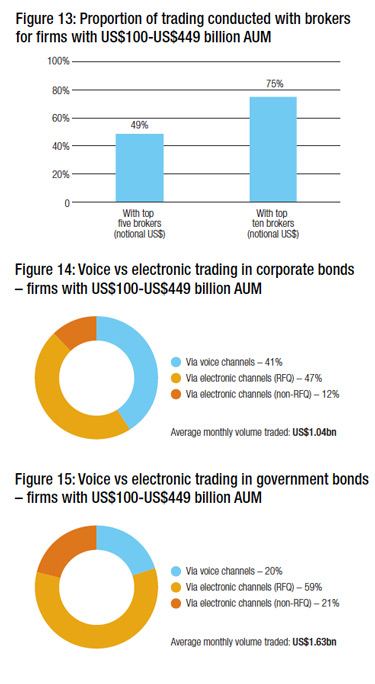
They use high-touch trading for a far smaller proportion of corporate bond trading (Fig 13), and although the amount of voice trading is similar for corporate bonds, they employ non-RFQ electronic trading for over 20% of government bond trading (Fig 14).
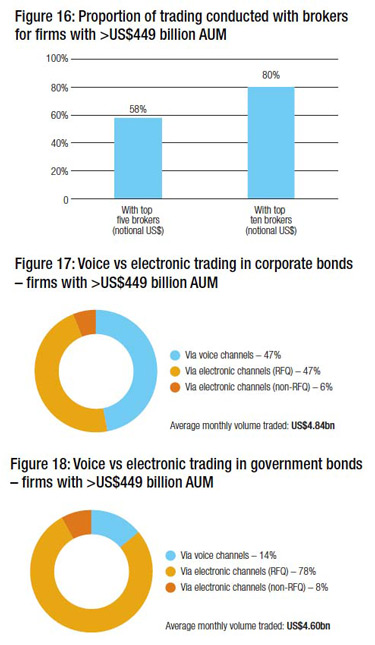
The largest firms had the highest concentration of volume going through their top five brokers, and ran 80% of volume through the top ten (Fig 15). They used voice trading slightly more than mid-sized firms for credit (Fig 16), but had similar levels of non-RFQ electronic trading across both credit and rates markets. They saw a similar proportion of voice trading for government bonds (Fig 17), despite a larger number of big firms being headquartered in the US and trading on the highly automated US Treasuries markets. Notably the numbers of European and US government bond traders employed by firms were very similar.
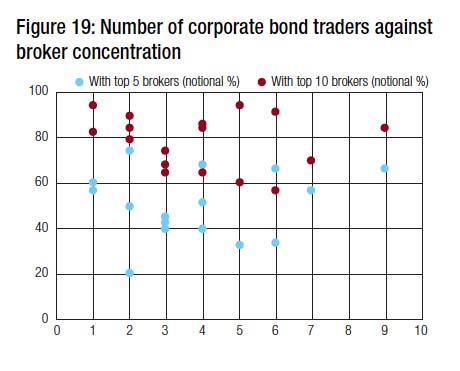
An analysis of trader numbers against broker concentration revealed the same ‘smile pattern’ we found in 2016, which also correlates with the size of firm / number of traders / concentration of trading volume found elsewhere in the study.
Conclusion
 The relative flexibility that is seen within mid-sized asset managers can reflect a number of factors. The largest asset managers by AUM have equally large trades and / or are large passive managers. As a result they may find high-touch trading is more necessary for large trades, whilst others can be automated. Their scale in turn can affect the range of brokers they are able to work with.
Conversely smaller firms have to concentrate order flow where they get good prices, limiting their overall broker list but ensuring they spread orders across their top ten to keep those relationships solid. They often lack the budget to invest in the tools that are seen amongst mid- to large-sized asset managers putting limits on their platform use.
Mid-sized firms are in the sweet-spot with a range of order sizes, a variety of business models less constrained by scale and with budget to commit to trading tools.
©Markets Media Europe 2025


 more valuable")


