


 Building on data gathered in our 2015 Trading Intention’s Survey, The DESK presents its findings for 2016.
The respondents.
This year we had 70 responses from North American, European and emerging market credit desks spread across 34 investment managers, with an aggregate of E15.4 trillion in assets under management (AUM). A caveat to the comparison with last year’s results is that the ten additional firms that responded this year represent a 41.6% increase in sample size and a 37.5% increase in AUM, up from E11.2 trillion in 2015. This year we asked which region each desk traded across. The proportion of responses representing European desks was 41%, US desks was 24% and emerging markets was 22%, with eight responses unspecified. That many responses were for multiple desks prevents an exact split by region, however to get a better feeling for the European and US markets we have analysed the multi-desk and single desk results for the US and for Europe (see ‘US vs. Europe’).
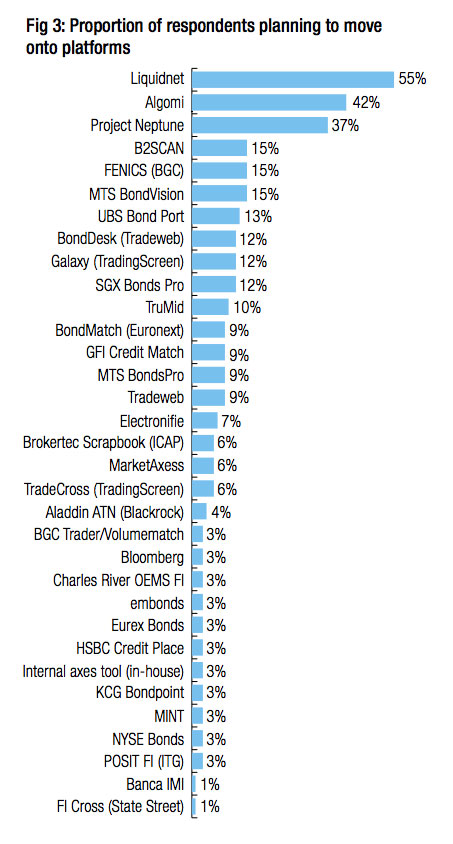
Fears that liquidity would be fragmented across multiple aggregation platforms are borne out by the Trading Intentions Survey 2016. The number of platforms being used for credit trading has increased. The proportion of respondents still planning to move onto any given platform has reduced – last year 18 platforms had a pipeline of 10%+ respondents, in 2016 just 11 platforms had a pipeline of 10%+ respondents.
- The number of platforms people use has expanded
- The number of platforms people plan to use has expanded
- The modal average depth of pipeline has reduced
- Realised growth was on average roughly 12 percentage points lower than the predicted growth from 2015 survey
Which platform?
Respondents reported using 28 liquidity aggregation platforms in 2016 (Fig 1), up from 19 in 2015. Of those 14 platforms were being used by at least 9% of respondents, where in 2015 outside of the three incumbent platforms – Bloomberg, MarketAxess and Tradeweb – only HSBC Credit Place and B2Scan had broken the 9% mark. Both HSBC Credit Place and B2Scan have seen respectable growth, rising from the 13% they each achieved in 2015 to 18% and 21% respectively. Looking at the platforms respondents planned to use from the 2015 survey, Bondcube has already launched and gone bust, but many others have achieved a successful start.
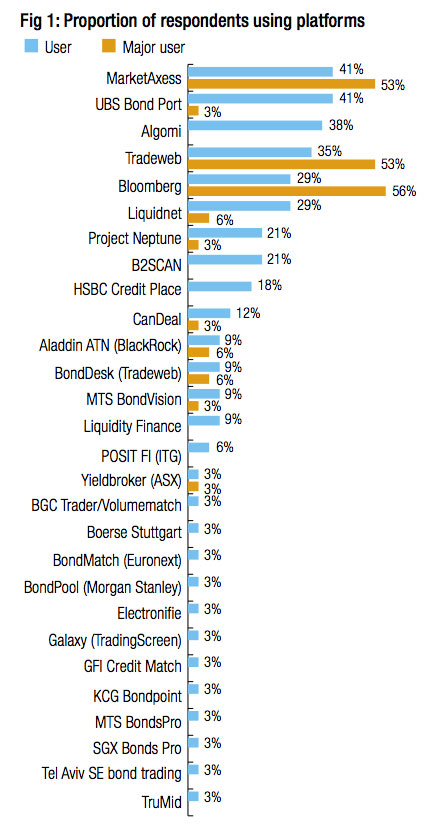
A breakaway success over this period has been UBS Bond Port (formerly UBS PIN). In 2015 just 4% of respondents planned to use UBS Bond Port, and 4% were using it. By Q1 2016, some 41% of respondents report they are ‘users’ of the platform, and 3% are ‘major users’. That gives it the greatest number of ‘users’ among the platforms that are anywhere near challenging the incumbents. Algomi, Liquidnet and Neptune had had pipelines of 54%, 58% and 50% of respondents in 2015, which by 2016 has converted to user bases of 38%, 29% and 21% respectively, with several respondents reporting themselves as major users of Liquidnet (6%) and Neptune (3%).
The ‘big three’, Bloomberg, MarketAxess and Tradeweb, have seen the level of business that investment managers run through them increase in either volume or importance to the buy-side traders. One trader said, “Plenty of new comers into this space delivering little that I see over and above the incumbents Bloomberg and MarketAxess for us.”
The number of firms registering themselves as ‘users’ of these platforms has fallen, while the number who consider themselves as ‘major users’ has risen to 56%, 53% and 53% – up from 50%, 38% and 33% – over the last year.
Each has fought to increase their use, by either offering new ways of trading – such as MarketAxess’s all-to-all Open Trading model and Tradeweb’s BondDesk – or by offering new tools to support trading activity, such as Bloomberg’s Liquidity Assessment Tool. Bloomberg has managed to develop the deepest relationships, given it has the greatest proportion of ‘major users’, but the balance between the top three is still close.
It is worth noting that many of the most successful models are not those which aggregate actionable liquidity. The services provided by Algomi, Neptune and B2SCAN all focus on the use of information to support where to trade rather than offering a venue to introduce the platforms as with request for quote (RFQ) systems, or any auction or order book.
This is worth considering alongside a recent survey by analyst house Greenwich Associates, which found that, proportionally, investment on buy-side trading desks into trader compensation had increased in 2015 to 69% of value, up from 64% of value in 2014, while investment in technology had fallen by a corresponding amount from 36% to 31%. While Greenwich Associates notes that this suggests ‘talent’ is beating ‘tech’, it also implies that increasingly there will be the need for tools to assist manual processing of trading opportunities. In equities the capacity to trading in an automated manner has been facilitated by the small number of issues and central automated markets. A similar dynamic has allowed high-frequency trading to deliver constant, if shallow, liquidity to the government bond market. By contrast the need to support human traders in assessing the vagaries of the credit market are evident in the level of support that information around liquidity aggregation is providing. As one trader put it, “Old fashioned phone broking and trader relationships [are] counting more now than ever as sell-side risk taking slides still further under the burden of regulation, and balance sheet constraints.”
US vs Europe
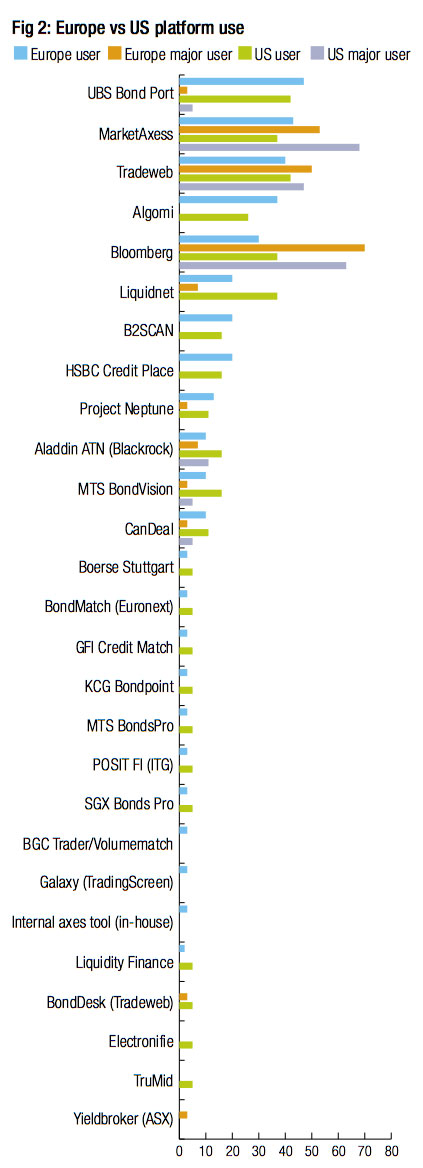
Many firms responded on behalf of desks working for multiple regions. By separating the non-US and non-European responses we have created a picture of US vs European use (figure 2). This is important for evaluating platforms that are geared to one region or the other such as Electronifie and Trumid in the US. It should be noted that because some entries that included both US and Europe desks, there is some double counting and statistical anomalies, making these charts useful to identify skew, more than precise proportions. One such anomaly is the proportion of firms with a US desk who plan to use TradeCross, a pan-European platform offered by TradingScreen. It reflects the higher proportion of firms that have both US and European desks who expect to use the platform, over those with purely European desks.
Big potential
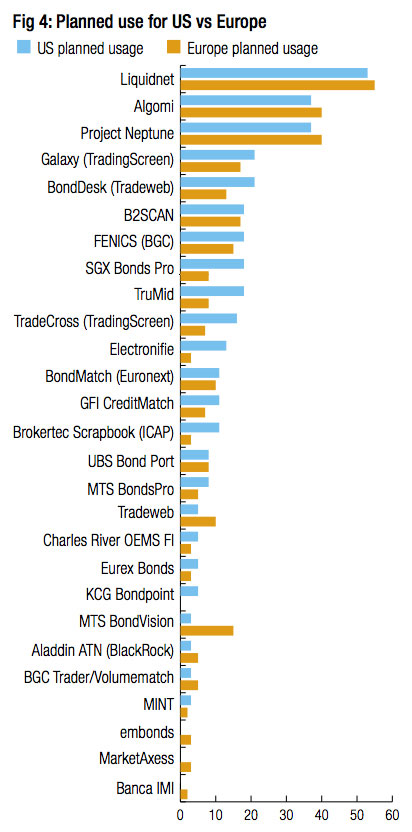
Liquidnet, Algomi and Neptune are first, second and third choice for the second year (Fig 3) as platforms that traders plan to use. B2SCAN is still solid both in the user base and potential growth. ITG Posit has fallen back in the race from its 2015 positions while BGC and TradingScreen both show good potential with two product offerings each. Separating out the pipelines across US and Europe (Fig 4) helps to create a more balanced view of future potential, for example 18% of respondents with a US desk are planning to use Trumid, and 15% of respondents with a European desk are planning to use MTS Bondvision.
Where to trade?
The platforms currently most effective at sourcing liquidity are identified as Bloomberg and Marketaxess as a close first and second, followed by Tradeweb, then Algomi (see Fig 5) and then Liquidnet, B2SCAN and UBS Bond Port in that order.
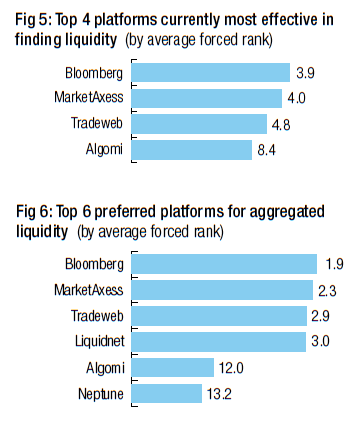
When asked where traders would most like to see liquidity aggregated, the first three were ranked in the same place albeit with a closer level of popularity and Liquidnet took fourth place (Fig 6), with Algomi and Neptune as fifth and sixth.
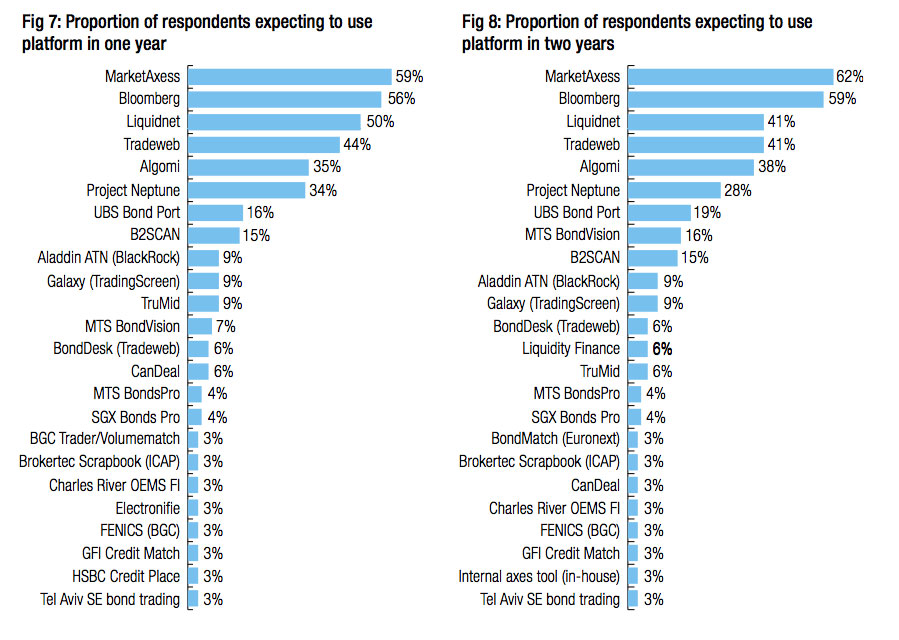
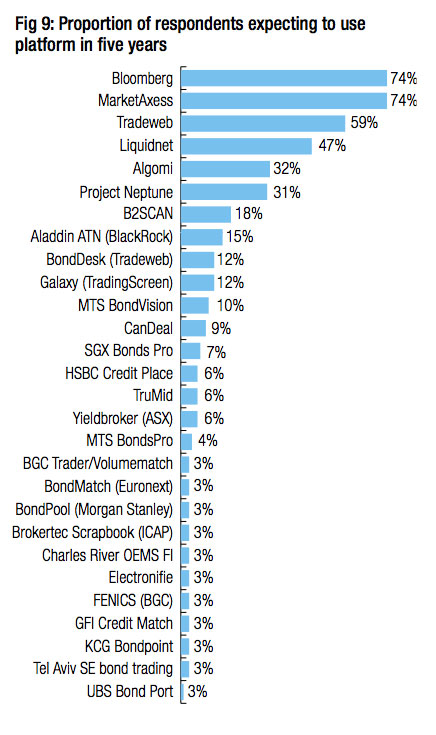
Future levels of confidence are hard to measure – several traders noted that their horizon for predictions did not reach to five years in the current climate – yet many others felt more confident predicting the platforms that they would have settled on in five years (Fig 9) than those they would be using in one year’s time (Fig 7) as can be seen from the proportion of responses.
Conclusion
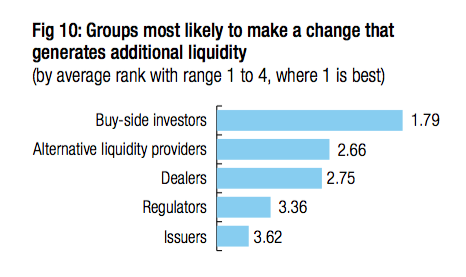
The launch of new liquidity aggregation platforms over the last twelve months has led – as expected – to a fragmentation of the market. Choosing which platforms to support has been challenging given the volatile nature of these new businesses and the chicken/egg challenge of moving liquidity onto a new platform. The timeframes for launch on several have been hazy and one has already shut. It is the buy-side and alternative liquidity providers who are most expected to make a change that generates additional liquidity (Fig 10) which suggests that platforms who are open to alternative liquidity providers may offer a new way of doing business that is acceptable to investment managers.
The poor liquidity picture we have seen in Q1 2016 will stretch the burn rate required for running many of these platforms. Those with other sources of revenue – including long-term investment from financial market operators and participants – will have an advantage. However ultimately this is about pooling liquidity and buy-side traders are clearly identifying certain models that they prefer.
©TheDESK 2016
TOP OF PAGE


")


