


Recent reports from market participants have given slightly different estimates for the use of portfolio trading in US corporate bonds, however the consensus is that trading was in the range of US$220 billion to US$250 billion to the end of October.
The estimate provided by market operator Tradeweb puts the size of portfolio trading at between four and five percent of total market volume reported to the Trade Reporting and Compliance Engine (TRACE) run by self-regulatory body FINRA.
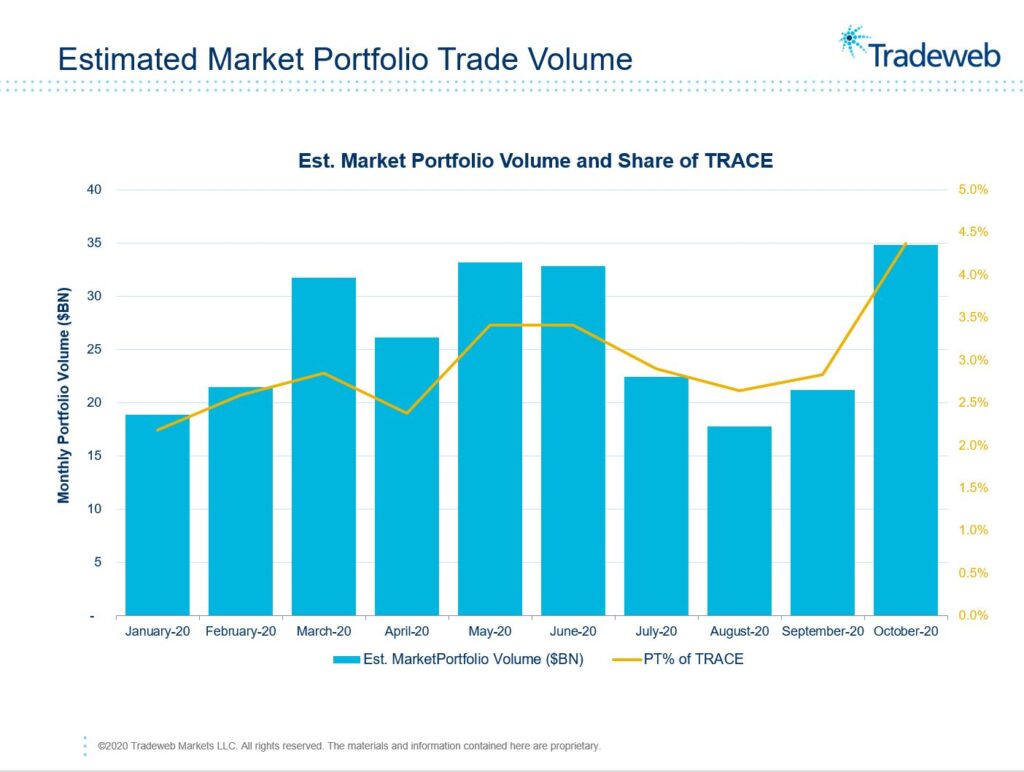
“In October we saw a record of nearly US$35 billion of portfolio trading,” says Chris Bruner, head of US Credit Product at Tradeweb. “The share of TRACE activity has been trending nicely upwards, from around 1% two years ago to 2% at the beginning of this year, to 3% over the last five months. Now we have seen this jump to 4.5% – so really double where we were in January which is a pretty material climb. We do need to be cautious not to overstate the significance of a single month because these are estimates and there’s risk the jump is for idiosyncratic reasons, however the overall trend is clearly of growth.”

The difference in estimates stems from the bond markets’ over-the-counter (OTC) trading model which relies largely on trades being conducted bilaterally between investment managers on the buy side and broker dealers on the sell-side.
“Dealers are really key here,” says Bruner. “In some cases when a new protocol comes along the dealers are already able to price it. Portfolio trading was developing off platform and on platform simultaneously, and that has meant when clients throw a portfolio at a dealer to price, they have developed the capability to do that. This would not work if the dealer capabilities were not there.”
Although trades in US corporate bond markets are reported to TRACE once they are completed, the reporting carries some limits. One of those is that portfolio trades are not tagged as such, requiring analysts use signals such as multiple trades occurring at the exact same point in time, to determine what is a likely portfolio trade.
Also, in order to prevent TRACE reports being used by traders to take advantage of other firms’ activity, for example by placing an upper limit on reported trade sizes of US$5 million for investment grade bonds and US$1mm for high yield bonds, so the exact size of large positions is not disclosed.
In a recent report, Morgan Stanley analysts multiplied the size of those capped trades by 2.28x for investment grade and 3.675x for high yield trades, a methodology they attributed to Bloomberg.
On that basis the bank found 2020 portfolio trading volumes of would have been approximately US$218 billion through October 2020, with approximately US$22 billion that month alone. Tradeweb’s ballpark figure for the same period – with the same caveat around estimates needed for Morgan Stanley’s work – was US$250 billion, with nearly US$35 billion in October.
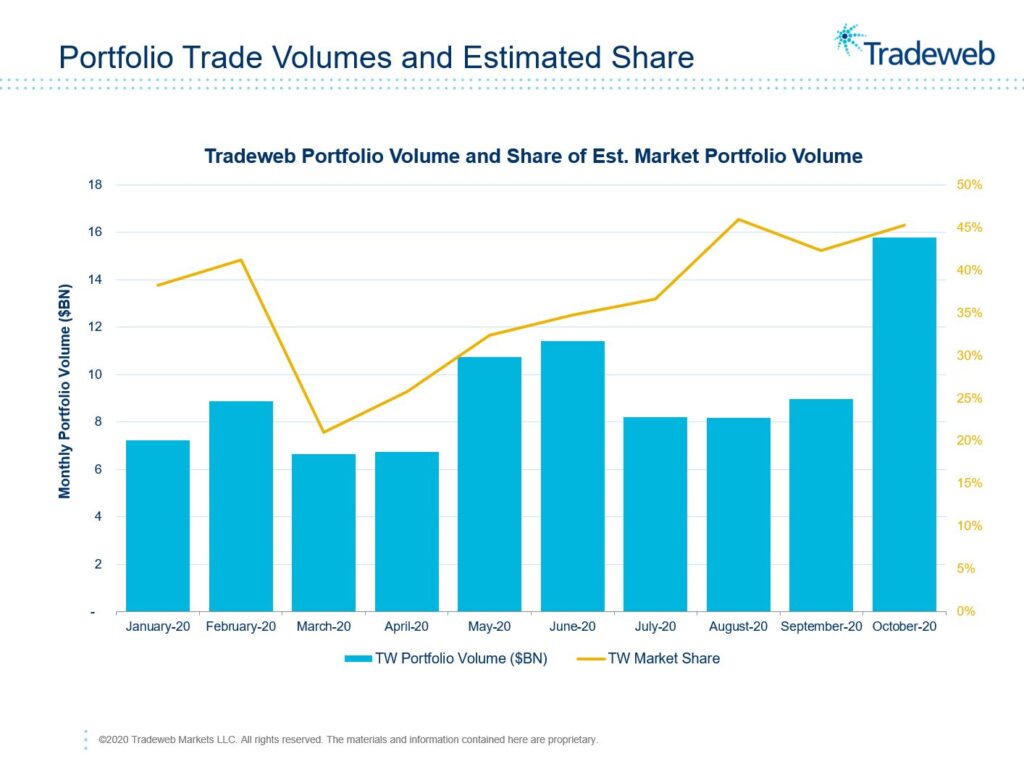
Tradeweb’s own trading volume for October was nearly US$16 billion giving it a 45% market share based on the firm’s own measure of market size, with the other 55% being a majority balance of direct dealer to client trades, and some trading on other platforms.
©Markets Media Europe 2025


 more valuable")


