


Better integration into trading workflow
The DESK’s execution research survey into fixed income TCA 2022.
Our research took in 40 major asset management firms’ use of, and opinions about, execution analytics / transaction cost analysis (TCA) in fixed income trading.
There has been a significant increase in the use of execution analytics in the trading workflow this year (Fig 1), with 50% of trading desks applying analytics, up from 37% last year. There has also been a decline in usage of the analytics to assess investment strategy performance, from 37% to 20% this year, which may well be tied to its perceived effectiveness; nearly half of respondents consider execution analytics ineffective in this function.
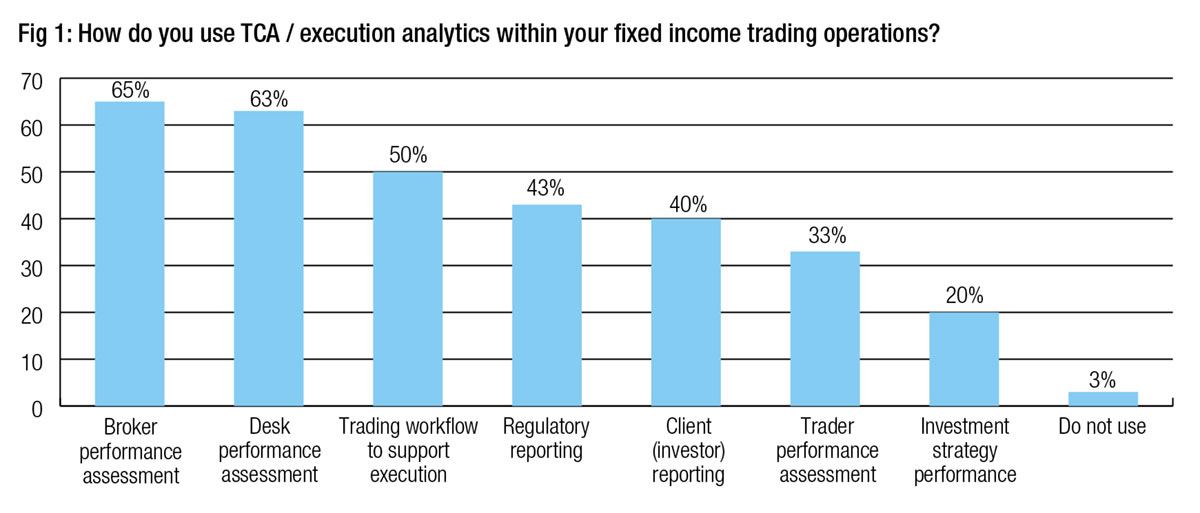
The main uses continue to be assessing performance of both brokers and the buy-side trading desk, followed by the increased use in trading itself.
 Less than half of firms use analytics in regulatory and client reporting (48% and 40%) with only a third engaging them to help assess individual trader performance. Only 3% of firms use no analytics in fixed income trading operations.
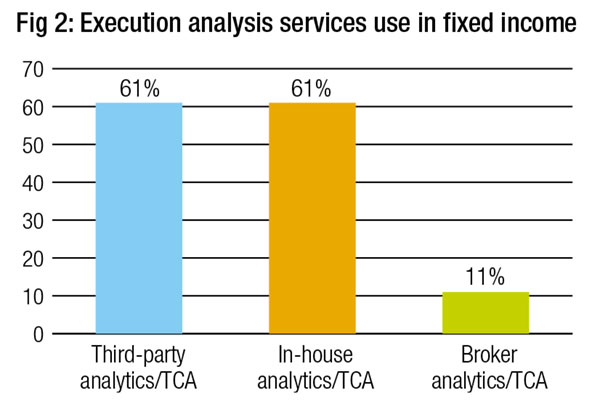
The majority of systems used to support execution analytics are either inhouse developments or third party systems (Fig 2), with broker TCA being far less commonly used in fixed income than in equities. That said, since 2021, there has been a equalisation of vendor and in-house systems being used, as the proportion of third party tools has declined. That suggests proprietary tools are proving equal to or better than third party systems.
Service providers
Of the service providers offering TCA / analytics, trading venues provide the lion’s share of use, with Bloomberg, MarketAxess and Tradeweb the leaders, followed by ICE Data, Virtu and BestX. Notably, most users of all services are ‘major users’, indicative of the low number of services typically used.
The average number of third party analytical tools used by buy side desks is 1.5, skewed by several outliers who have 5-7 systems, with 1 being the median number of systems used. Several firms use no third party systems, with one having no execution analytics of any sort.
There has been a change in the proportion of third party systems being used since last year (Fig 3); Bloomberg has seen a nine percentage point drop since 2021, but still maintains its lead as the most used execution analytics tools. Tradeweb saw a 12 percentage point drop pushing it further down the rankings than last year. MarketAxess’s user level has meanwhile been steady, allowing it to move up two places, just one percent ahead of Tradeweb. Virtu has likewise gained positions by holding steady. ICE Data has delivered a 5 percentage point increase since 2021, putting it in fourth place this year.
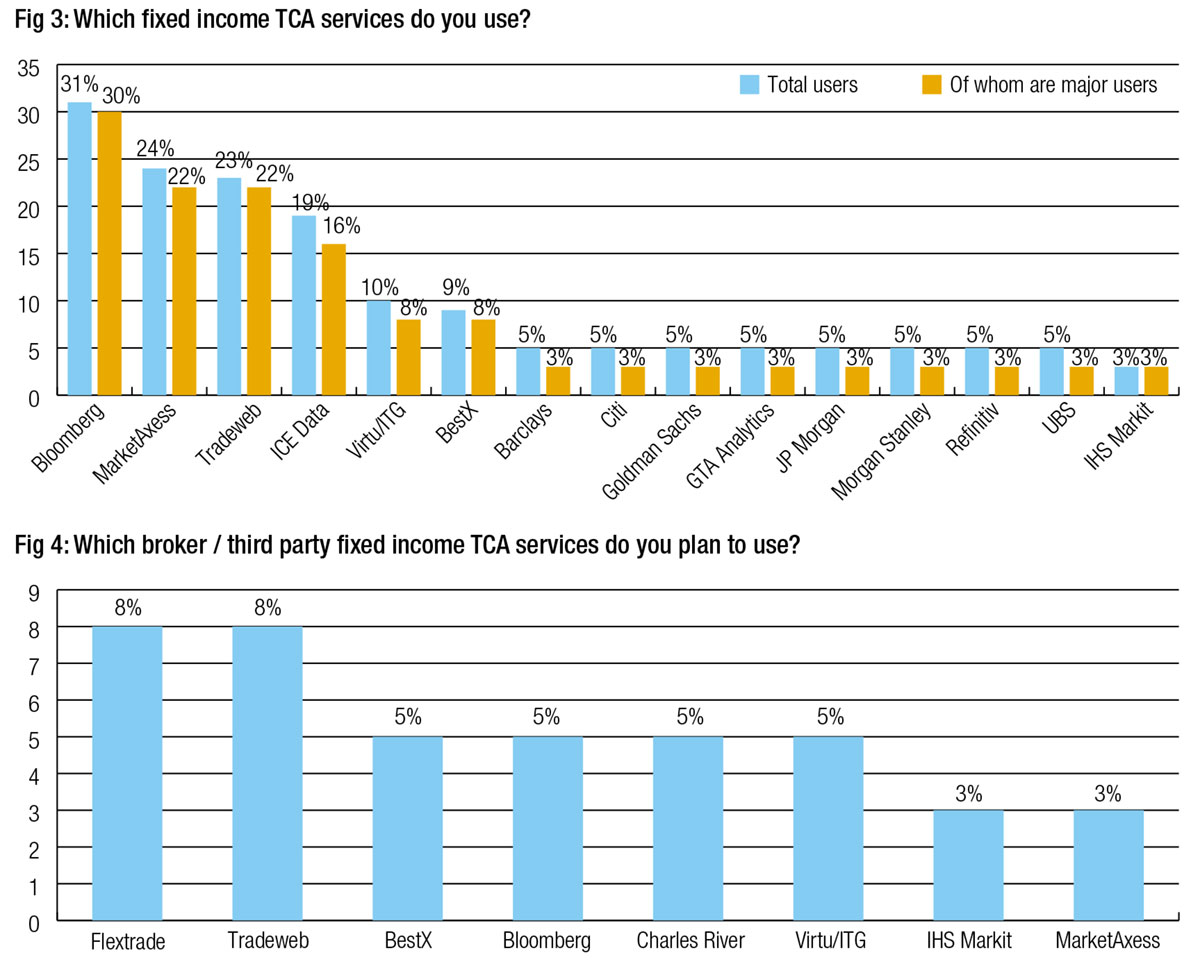
IHS Markit has crashed in its placing, from fifth place last year with 20% use to just 3% this year, while Charles River Development also saw a drop from 9% in 2021 to 3% in 2022.
Looking ahead, both FlexTrade and Tradeweb have the best pipelines of new business (Fig 4), but overall there is limited appetite for switching / expanding providers, suggesting that buy-side desks will want their existing providers to improve functionality to meet any shortfall between expectation and delivery that exists today.
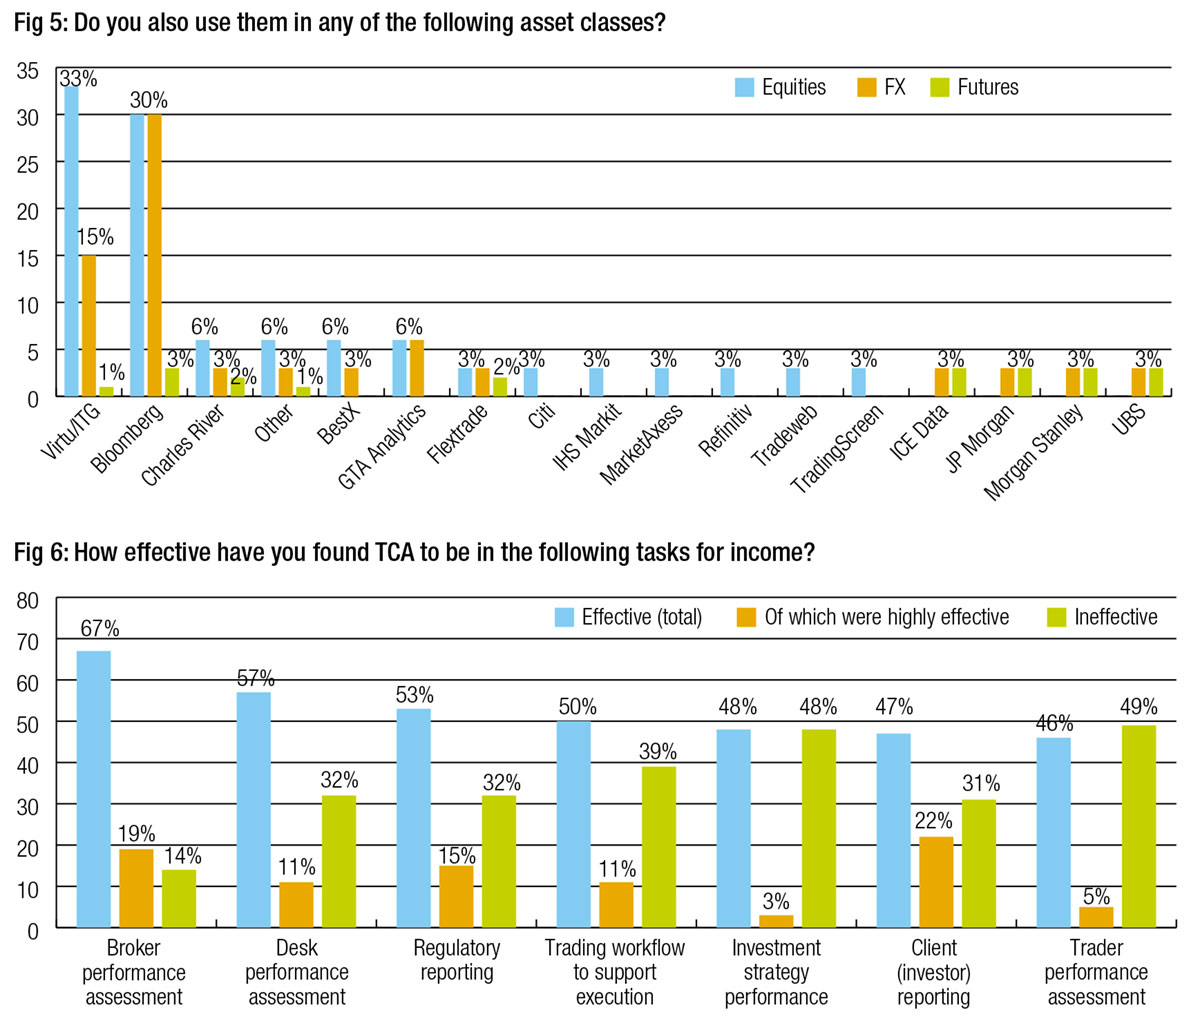
Only Virtu and Bloomberg have significant cross-asset success (Fig 5, for both equities and analytics).
The most effective use
The perceived effectiveness of execution analytics in fixed income this year (Fig 6) has similarities to the responses from 2021 – broker performance is found to be the most effective use, while evaluating trader performance is seen as ineffective – but there are some changes. Its value in assessing desk performance is perceived to have improved; in 2021 the same proportion of users saw TCA as ineffective as thought it to be effective, where a majority now see its value.
A lower proportion of traders see client reporting function as effective, yet with 22% seeing it as highly effective, it has the most vociferous support amongst a small core than any other category. More believe TCA to be ineffective for regulatory reporting than in 2021.
Getting under the surface of these differences, we looked at the way the major different providers’ services were used, and the perceived effectiveness of them (Fig 7 to 18).
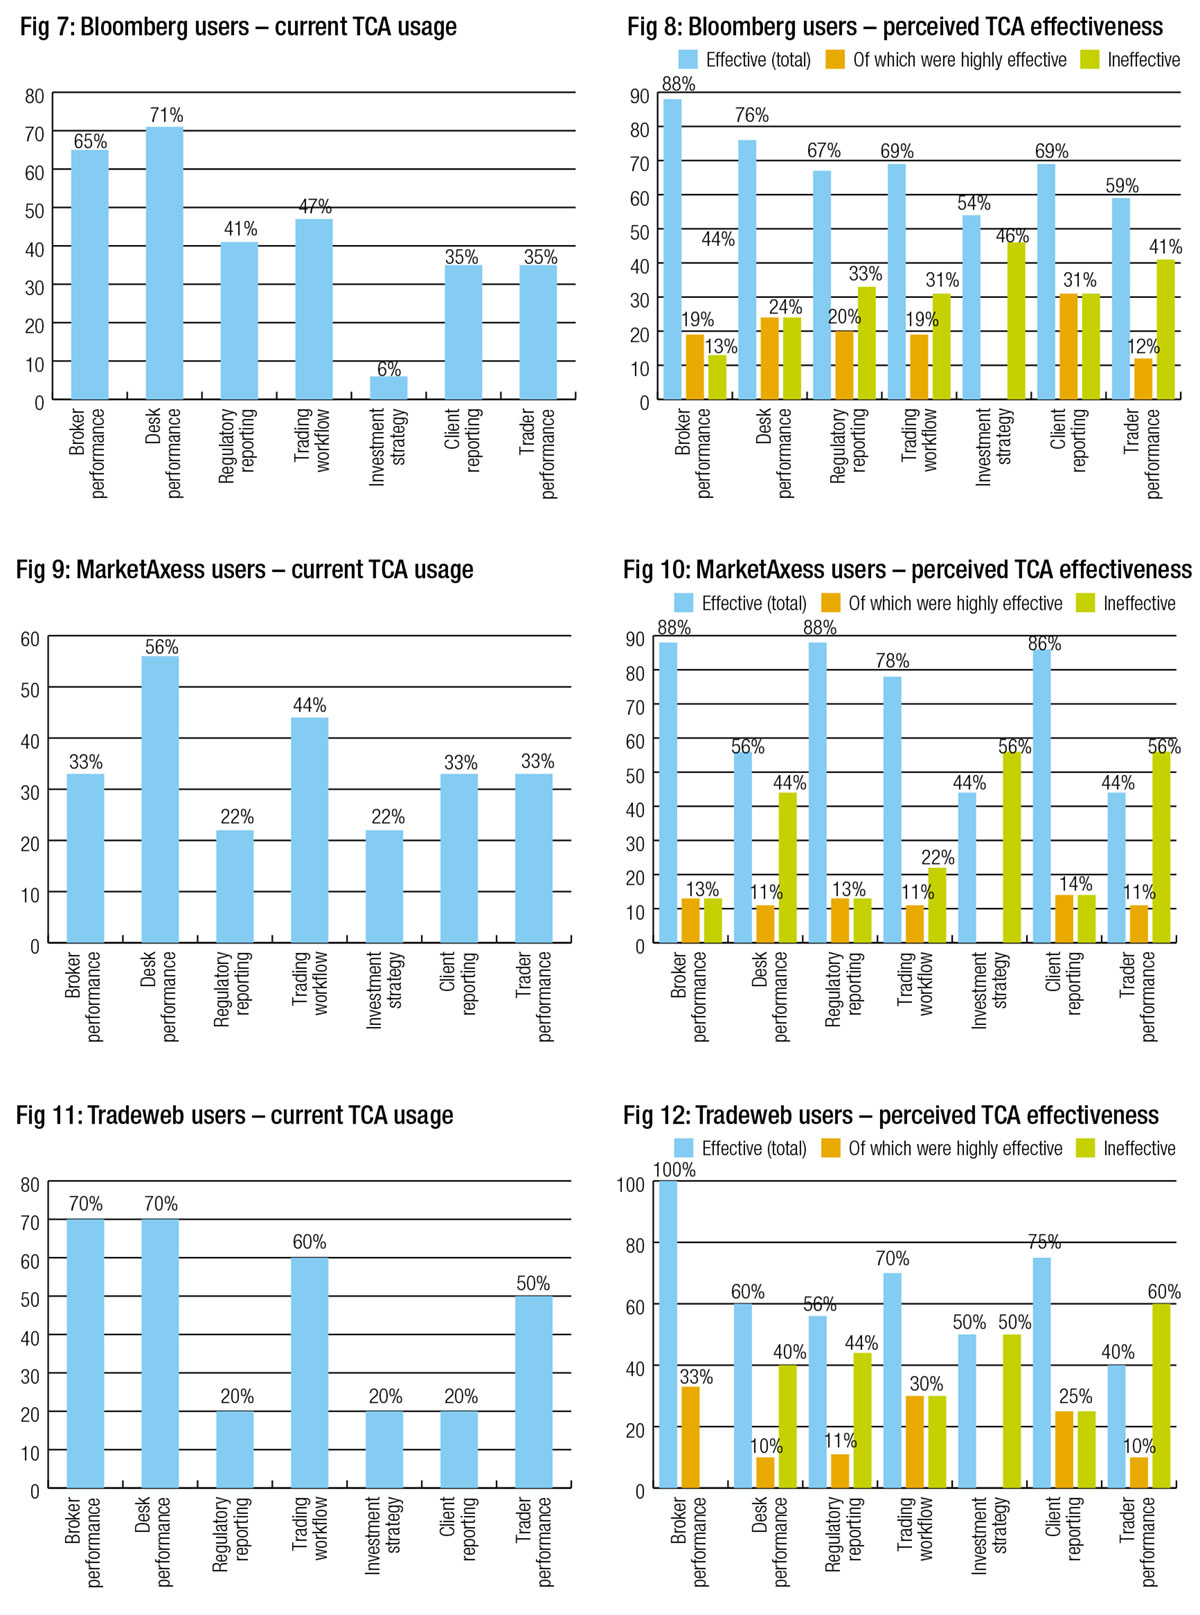
While this analysis becomes less nuanced for TCA providers with a smaller proportion of users, due to the smaller sample sizes, it does roughly outline how the services provided by different providers are used, and where their major strengths and weaknesses are according to users. There are frequently cases where level of use exceeds perceived effectiveness, and where perceived effectiveness exceeds levels of use. In each of these cases, more could be done to either enhance a service by the provider, or to make better use of a service by the client.
Better execution through better analytics
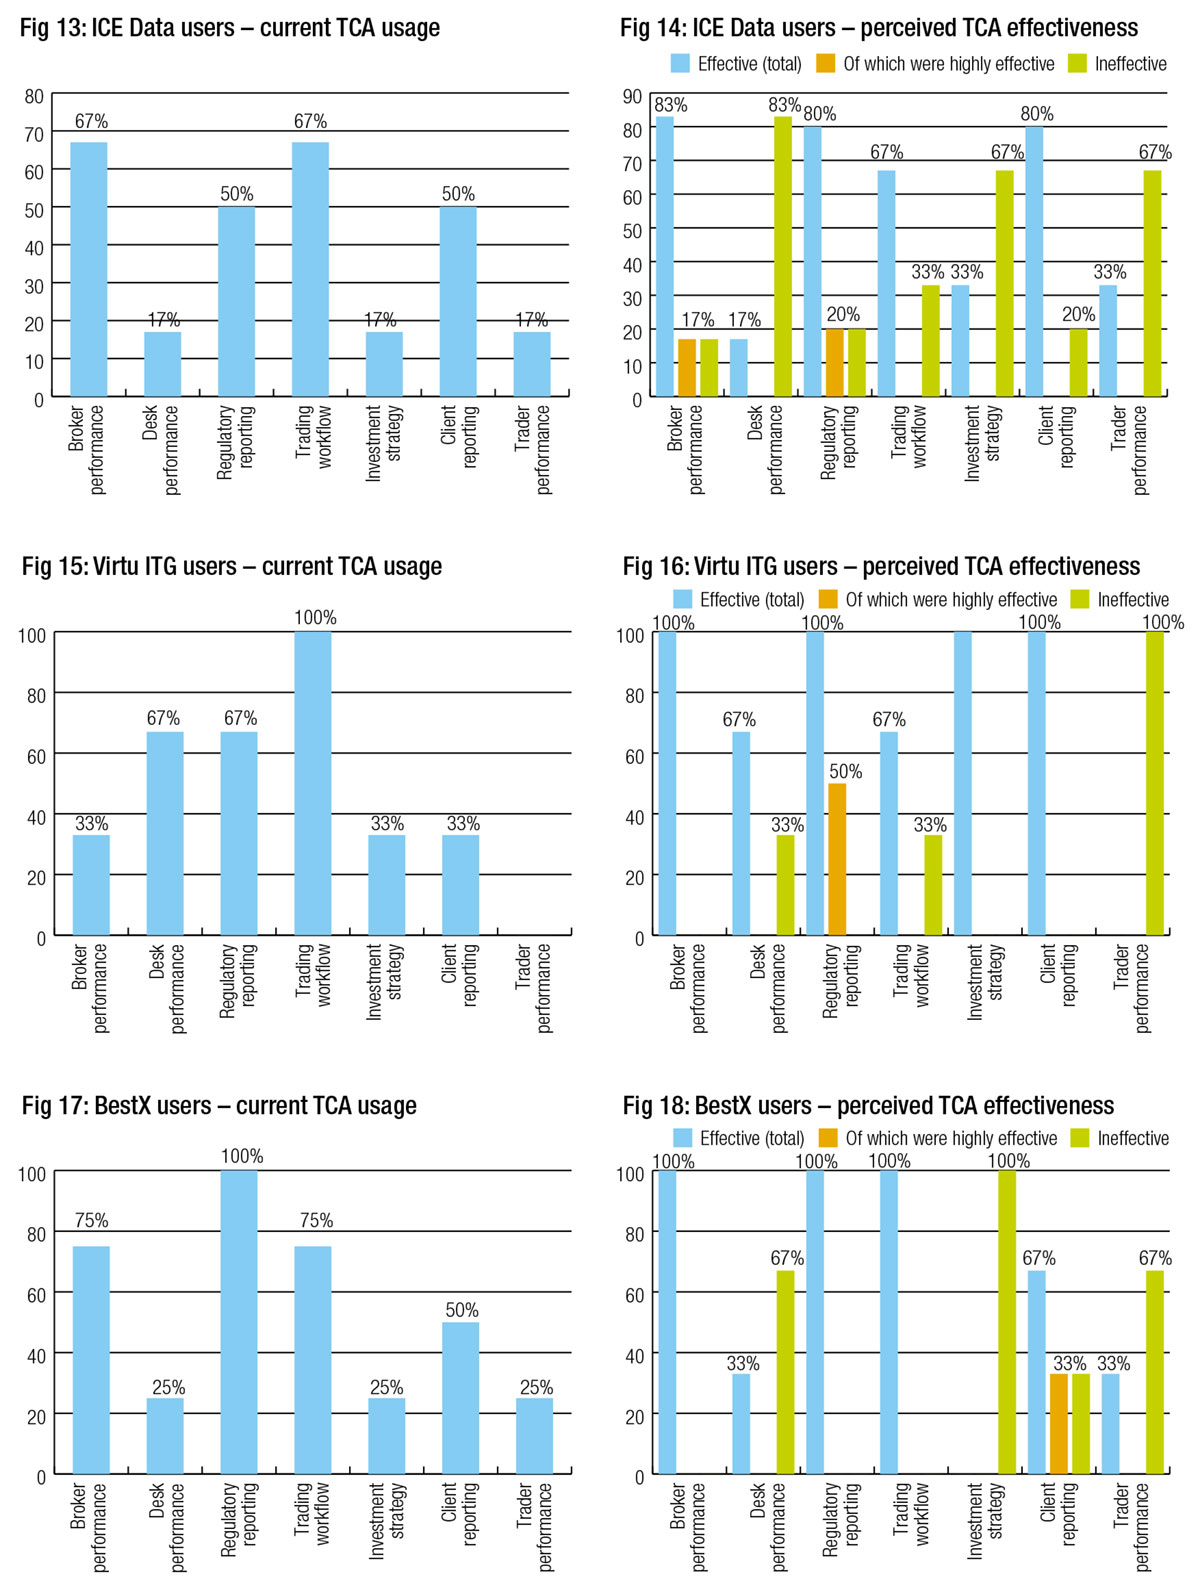
Data this year indicates a far greater range of potential improvements could be made to TCA/analytics than were registered last year, when 51% of traders wanted better data and every other factor received 11% or less of the vote (Fig 19).
In 2022, data is still the biggest issue with 64% of traders wanting quality to improve, but also half of traders want to see better recording of unstructured data and a broader range of fixed income instruments. Close behind, we see distinguishing between high and low touch execution is also important to 44% of traders, while integration of OMS/EMS and trading venues and more granular data are also seen as important.
We have seen many more data and analytics products launched in the past year, which may have delivered better support for analytics, and while it appears that data still needs improvement it is positive to see that analytics are now at a point where further details and functions need improvement beyond data improvement.
Demographics
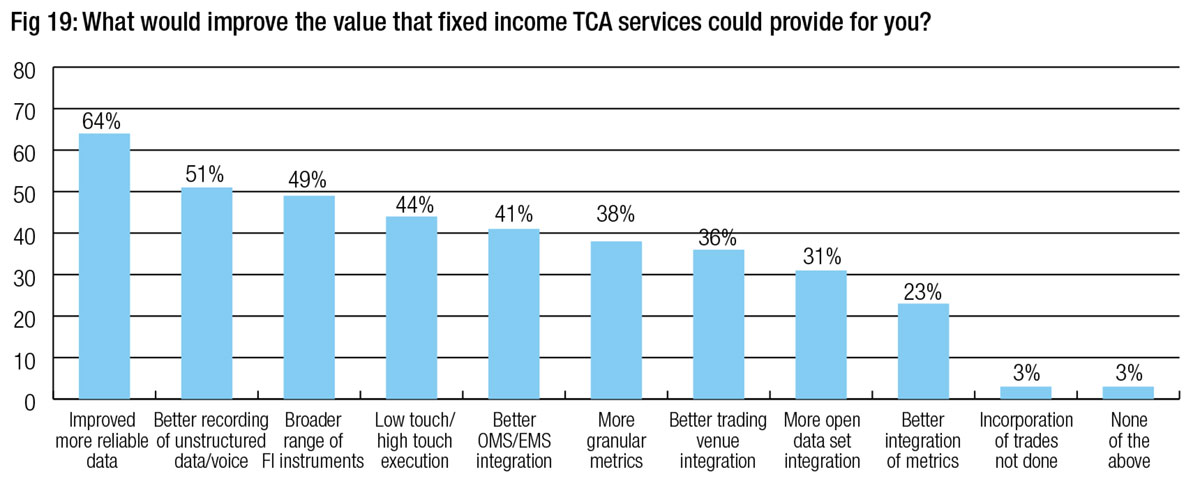
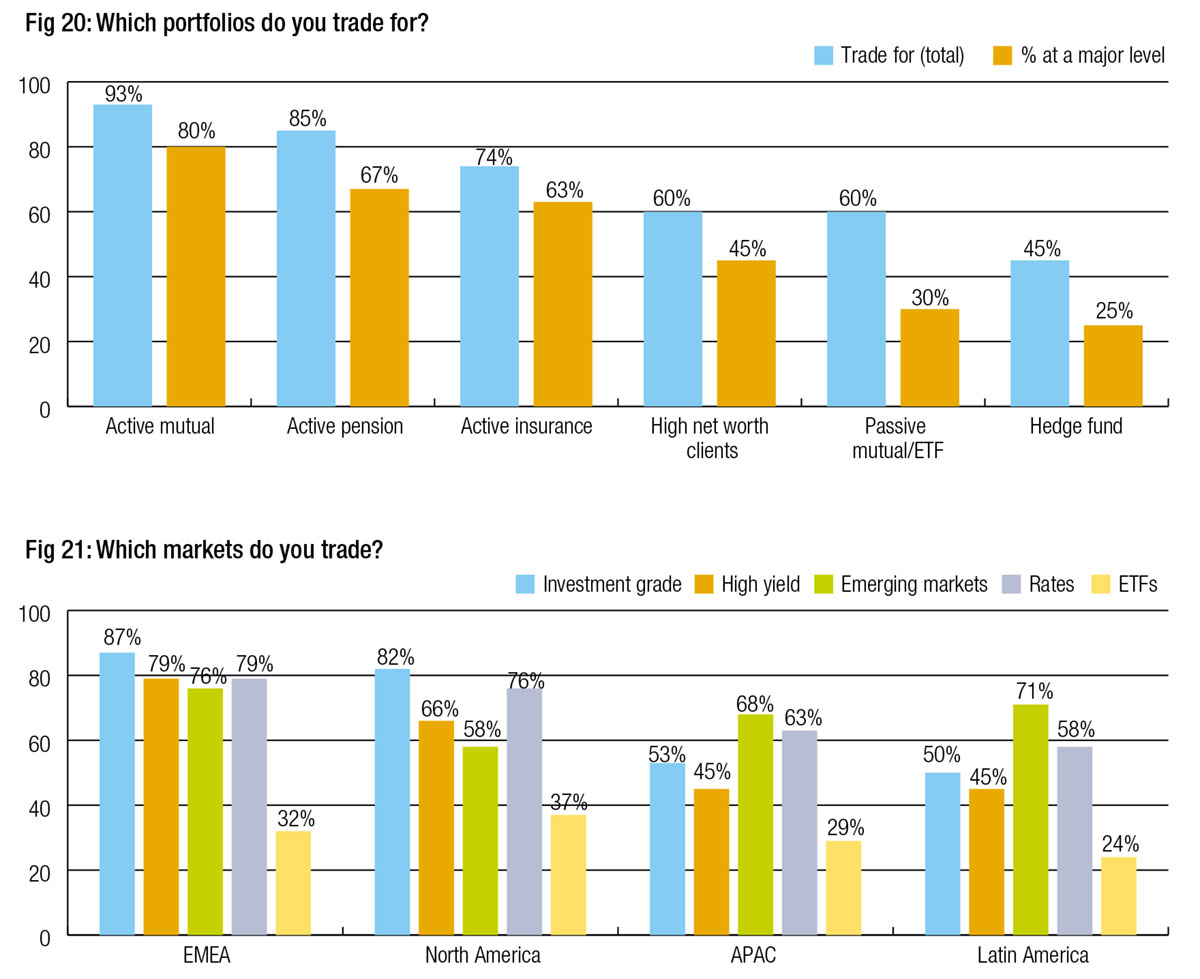
The trading desks that took part this year mostly trade for long-only fixed income mandates (Fig 20), with the greatest proportion (Fig 21) trading investment grade credit and rates in North America and Europe, Middle East and Africa (EMEA), followed by high yield (HY) in EMEA, emerging markets in EMEA, Latin America and Asia Pacific, and then US HY.
©Markets Media Europe 2025


 more valuable")


