


Larger firms are able to take advantage of more bespoke trading opportunities, but location matters.
The DESK’s latest trading protocols research has found that the proportion of trading activity routed along different execution protocols is tied to an institution’s size and the market structure in their geography, which affect the practical ability of desks to both execute against different peers, and to make demands for tailored liquidity streams.
Surveying 30 buy-side institutions with assets under management between sub-US$50 billion AUM up to US$1 trillion or more, and across firms headquartered in EMEA, the US and Asia Pacific, the research splits results by trading for active and passive portfolios.
Looking at the net figures for all firms, it is clear that electronic trading via request for quote (RFQ) has maintained its lead as the most popular execution method, either setting dealers in competition (in-comp) or by reaching out to buy- and sell-side trading firms via all-to-all trading, for both active and passive portfolios (Fig 1).
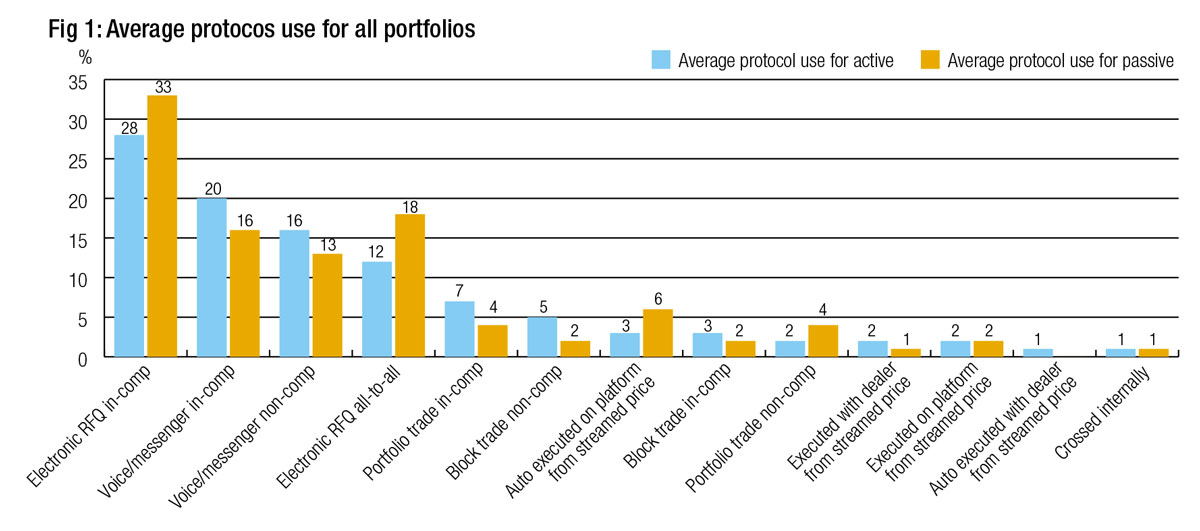
Voice trading both in-comp and non-comp still have their place overall, biased towards trading on active portfolios which is typically less systematised, while passive portfolios are able to take greater advantage of electronic trading via RFQ with dealers and all-to-all.
Portfolio trading is in line with market estimates – around 7% in comp for active, although overall PT for passive investors looks a little low – while auto-execution has shown great success to hit 6% on platforms for passive portfolios overall.
However, looking at the net figures masks nuances seen between the way firms of different sizes – and in different locations – trade.
The transatlantic divide
A noticeable division between firms is their place of headquarters, with US investment managers engaging with a broad range of trading protocols for both passive and active trading. The split does reflect both a difference in size – larger respondents were more frequently from US-based firms – and also in the way trading protocols work.
For example, electronic request for quote (RFQ) makes up 28% of trading for passive funds and 16% for active in US markets (Fig 2), while making up just 12% and 11% respectively in European markets (Fig 3). One of the reasons behind that is buy-side firms struggle to make prices in European markets because the window for responding to an all-to-all request on some platforms is smaller. Not all buy-side firms have the capability to make a price in a tight time window and as a result there is less participation.
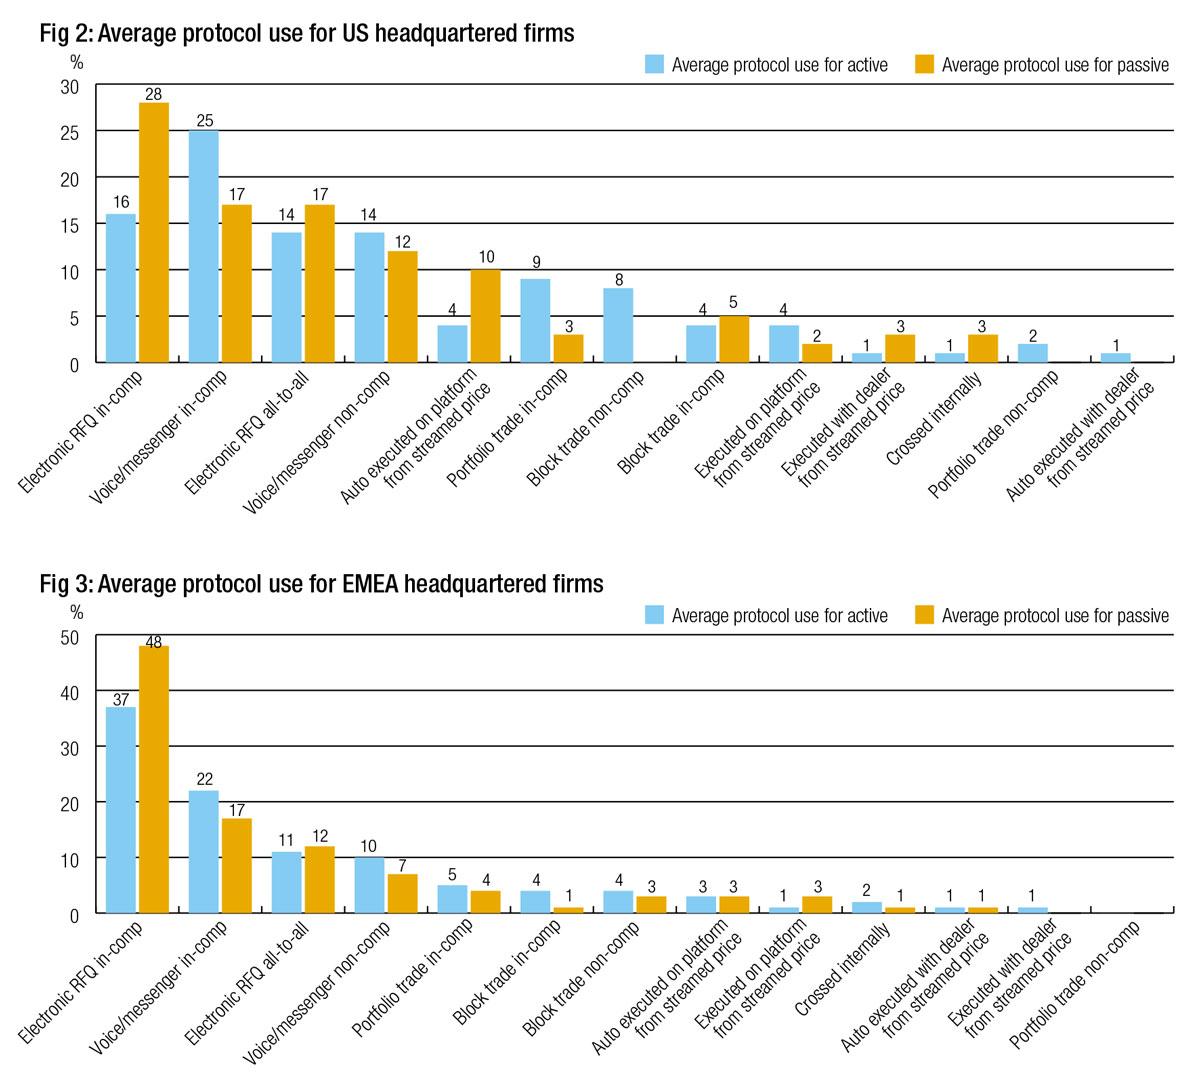
However, the use of RFQ to dealers in comp is the most-used protocol, proportionately in Europe, indicating the appetite to electronify trading is considerable, with nearly half of activity for European passive portfolios being traded that way.
US headquartered investment managers are more inclined to trade non-comp with dealers either by messenger or over the phone, which may reflect the difference in best execution regulation between Europe’s Markets in Financial Instruments Directive (MiFID II) which is commonly read as advocating in-comp price formation, and the Securities and Exchange Commission (SEC) rules, which do not separate payments for trading and research to banks, and can therefore see trading commissions routed to brokers based on a range of factors which include best execution.
The rollout of newer trading protocols in US markets is apparent with streamed prices from dealers and portfolio trading being used more by US-headquartered firms than European-led firms, although again this can reflect the size of businesses, with dealers more inclined to price lists of securities, and to set up direct pricing streams, when an investment manager has a significant level of business to run via the broker.
Trading for smaller buy-side firms
Investment managers with less that US$50 billion in fixed income assets under management (AUM) show little difference in their trading styles based on active or passive portfolio (Fig 4). They typically use high-touch trading for active and passive portfolios on an even balance, with voice trading used across both types of portfolio. All-to-all trading is most used for passive fund trading.
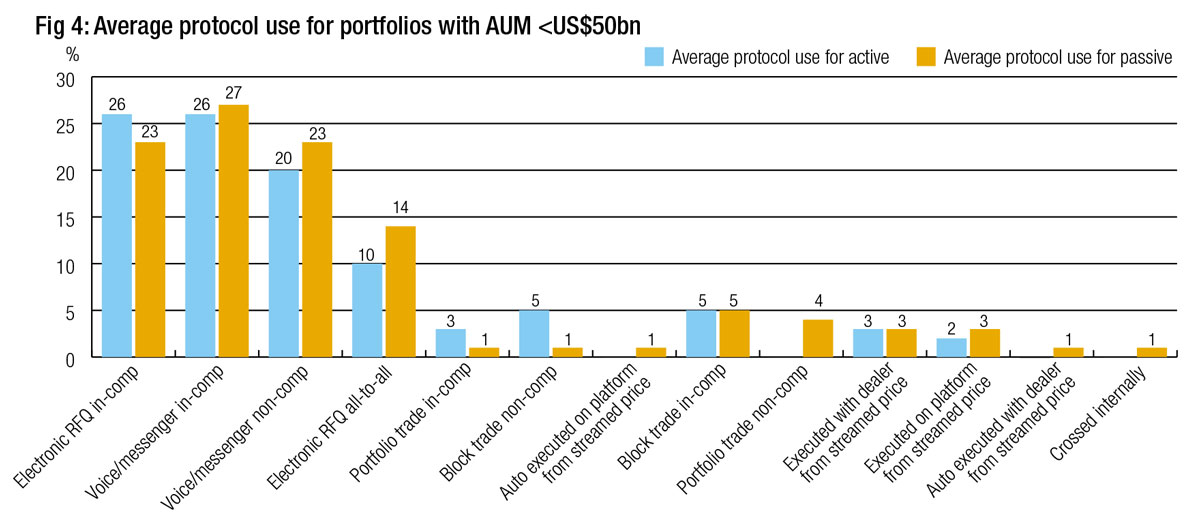
Portfolio trading is low compared with industry norms, having 4% use in non-comp for passive funds, and 3% in-comp for active. Auto-execution is barely used.
Active portfolios see most use of block trades, in low single digit levels for non-comp and also for in-comp trades across active and passive portfolios.
Many trading protocols such as streamed pricing see very activity by firms of this size; notably all protocols outside of voice/messenger or RFQ have a low to zero percentage level of activity.
For slightly larger firms, with anywhere between US$50 billion to US$100 billion AUM, electronic RFQ become considerably more important for both types of portfolio, potentially due to the efficiency gains and data gathering that this protocol provides even at low levels of investment via trading platforms, relative to voice trading (Fig 5).
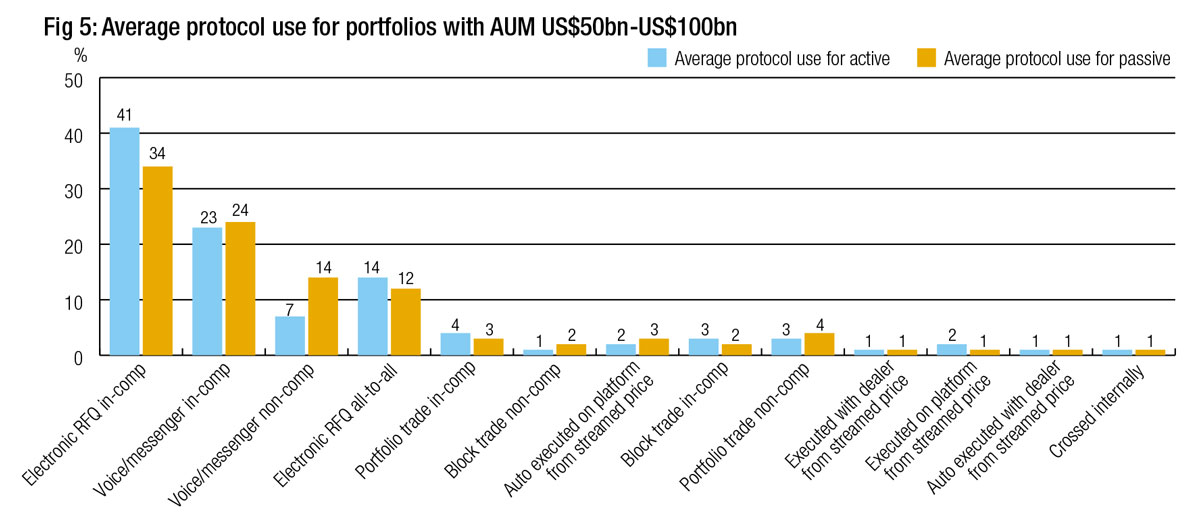
The proportion traded by voice/messenger is still relatively even at this point, becoming more prevalent for passive funds non-comp. All-to-all trading is more evenly balanced between active and passive portfolios.
Overall a wider range of trading protocols are being used than for smaller firms, even if the proportion of trading executed via those channels is low.
Mid-sized firms show higher adoption of innovation
Trading activity at firms with US$100-US$500 billion in fixed income AUM sees a far more even distribution across protocols (Fig 6). Although passive portfolios appear skewed heavily towards dealer-to-client e-trading via RFQs, that reflects certain participants’ heavy reliance on them; looking more broadly we can see auto-execution, portfolio trading and block trades all sitting in the mix.
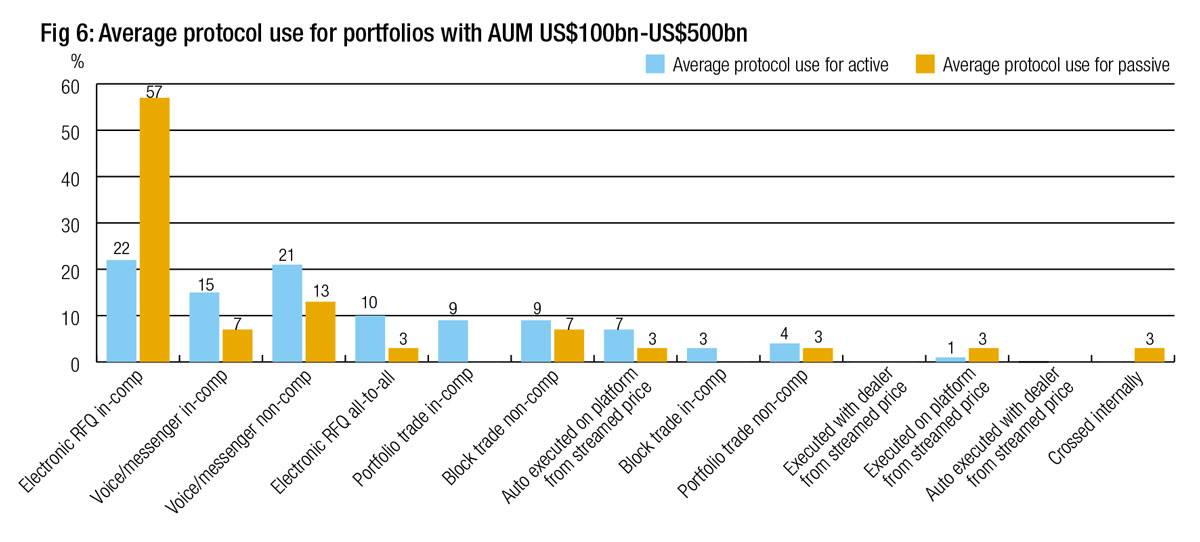
At this size of firm, at least some trading is taking a more innovative approach to find the path to better execution. This does often require the support of counterparties and the volume of trading a business drives to dealers and platforms can determine the extent to which they are shown and supported via new trading methods.
As we look at the larger mid-sized firms with between US$500 billion to US$1 trillion in AUM, it is clear that the value of traditional execution methods – RFQ, voice and messenger – is falling proportionately to newer trading models (Fig 7).
In-comp RFQ and all-to-all take the lion’s share of trading for passive portfolios at this level, reflecting a heavy bias in some firms toward the latter, while auto-execution and portfolio trading provide higher levels of support notably for passive portfolios.
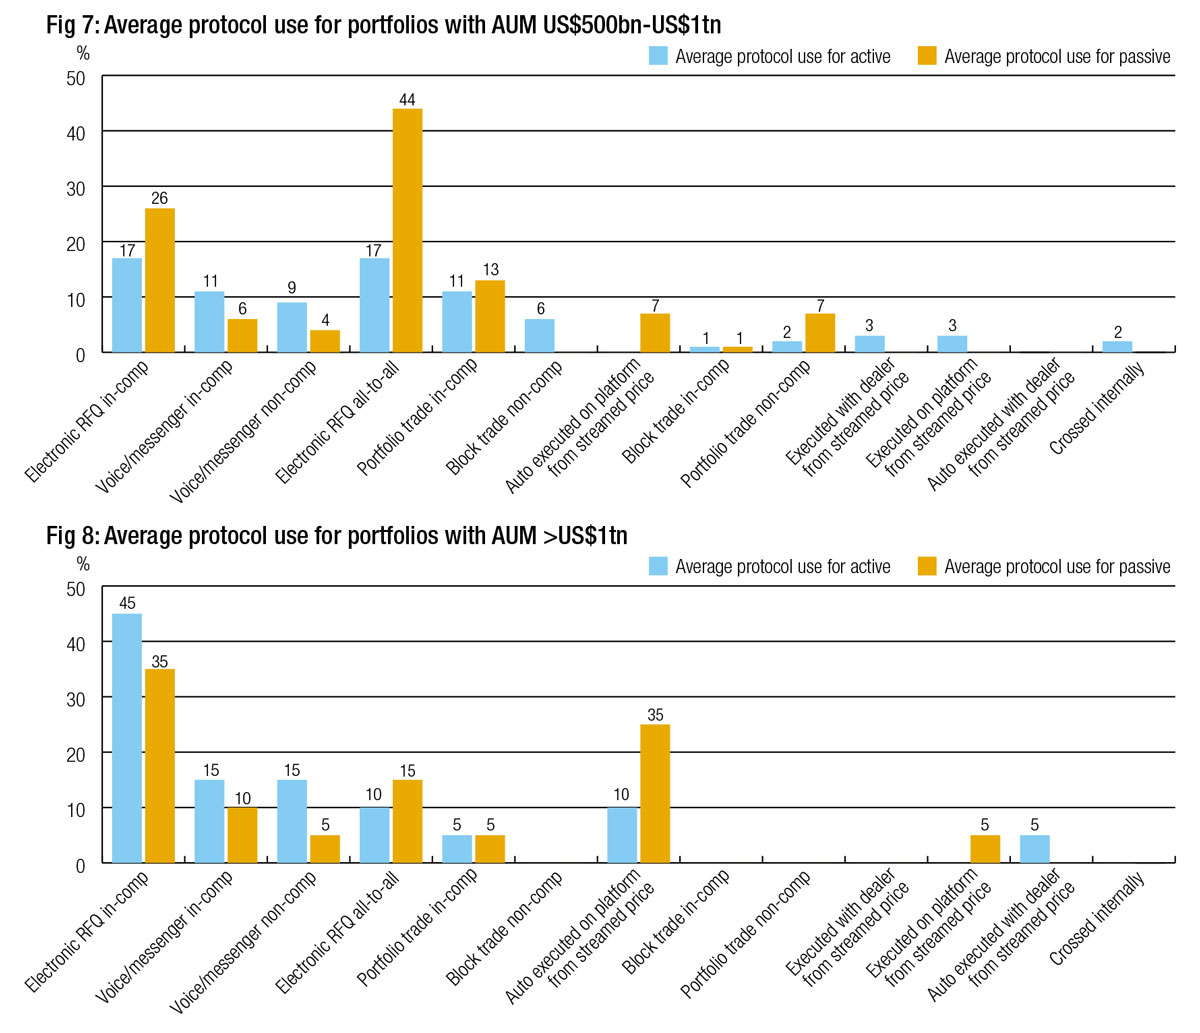
Outsized trading strategies
Fewer firms have over US$1 trillion in AUM which makes the result for this sector more easily swayed by individual results and potentially less representative of this demographic (Fig 8). We see a significant bias towards RFQ, more so for active than passive, and a significant level of engagement with auto-execution on platforms for both passive and active portfolios. Streamed prices and portfolio trading are also used effectively across active and passive trading.
About this study
 We surveyed 30 buy-side firms’ trading desks, of whom 60% were headquartered in Europe, 37% in the US and 3% in Asia Pacific, with a wide range of fixed income assets under management.
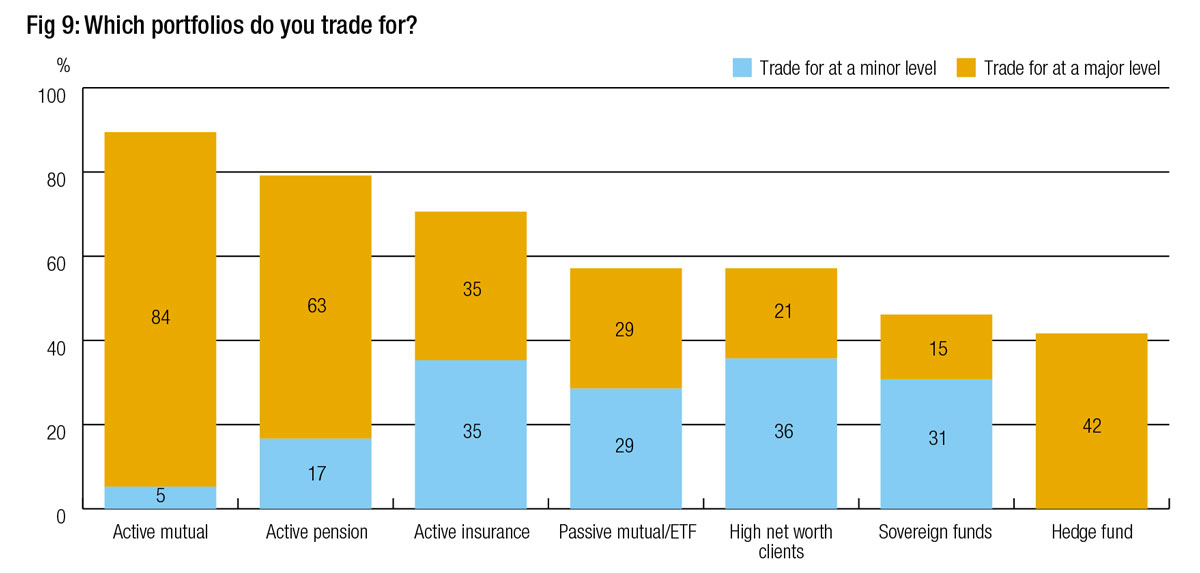
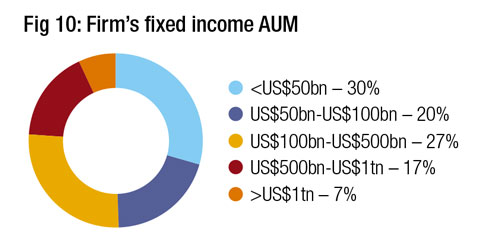
The participants largely trade for long-only portfolios with mutual fund, pension and insurance mandates, with over half also trading for passive funds and high net worth clients (see Fig 9 and Fig 10).
©Markets Media Europe 2023
©Markets Media Europe 2025


 more valuable")


