


Looking back at this year’s trading activity, through analysis of MarketAxess Trax data and TRACE for US markets, we can see clear patterns emerging across investment grade (IG), high yield (HY) and emerging market (EM) bonds.
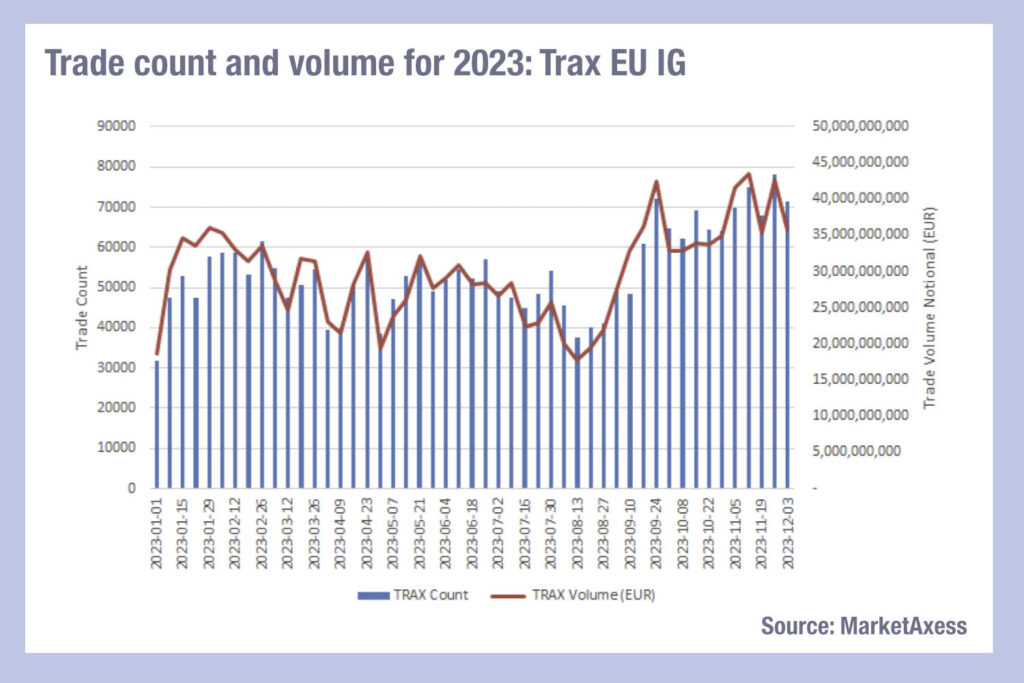 Taking investment grade first, we can see that a similar pattern of trading activity occurred in US and European markets, with the trade count starting relatively low to notional traded, giving a proportionately average large trade size.
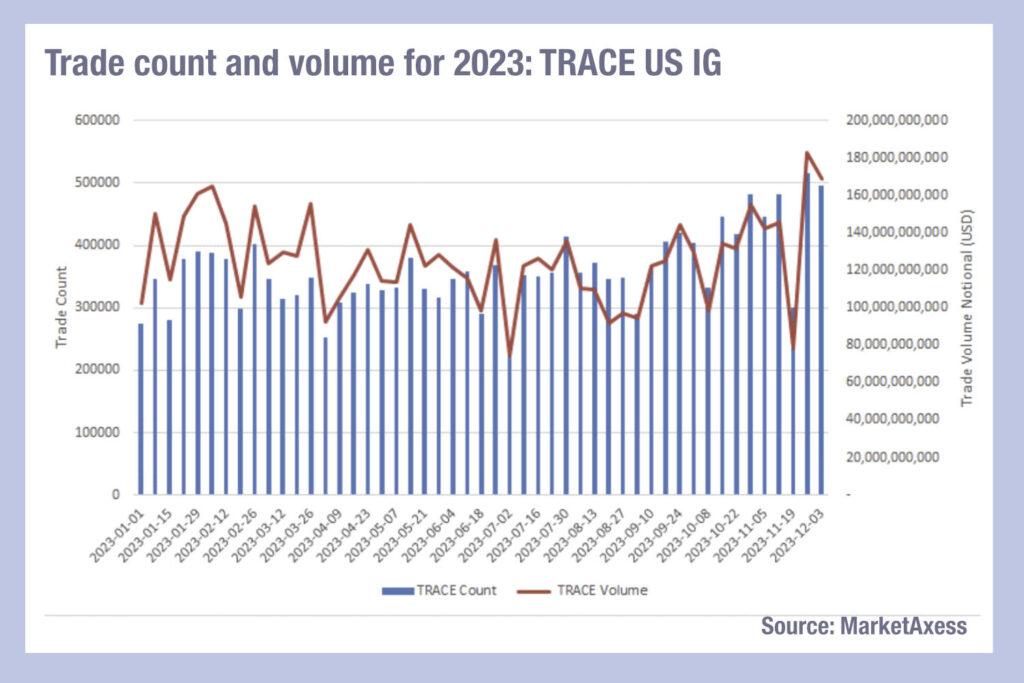 Overall US markets show a greater variability in trade sizes, looking spiky through the year. European markets changed more gradually, possibly a reflection of the smaller average size traded in North American markets. The low point for the year was the week of 7 July when notional traded hit US$74 billion and trade count fell to 303k.
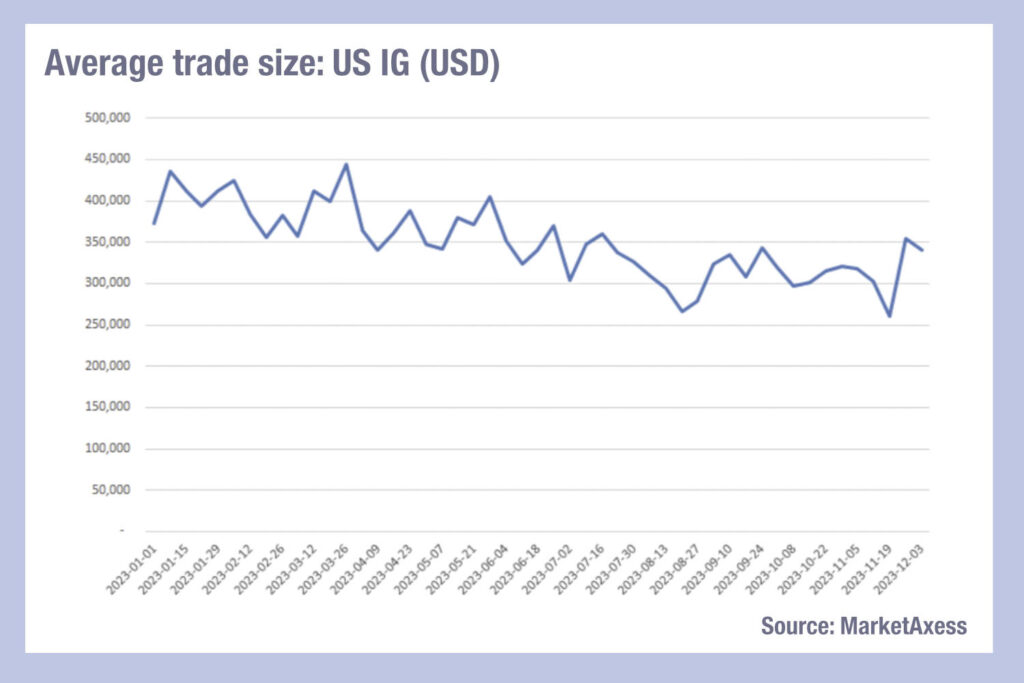 As noted in the last Barnes on Bonds, we’ve seen liquidity costs increase in US credit at the end of the year, which may reflect dealers becoming risk-off as they window dress their books to optimise systemically important banks (GSIB) capital requirements. If we step back from that anomalous jump, average trade sizes had twice fallen close to US$260k from US$374k at the start of the year, a massive drop, and certainly worthy of further analysis.
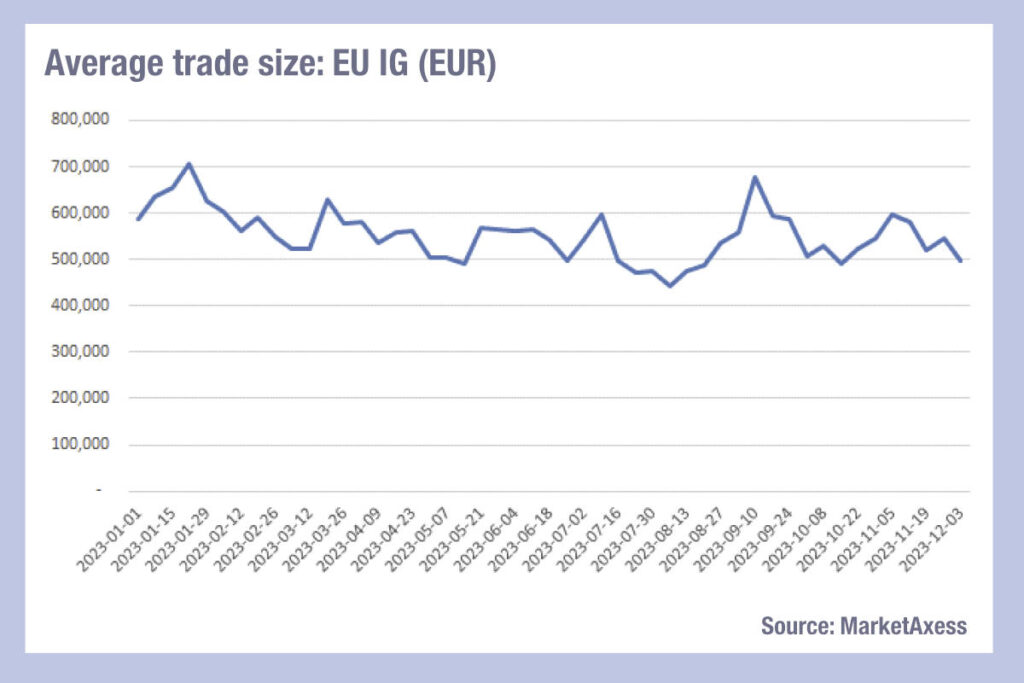 In European IG the fall from €587k in January to €498k in December was also a big drop off, albeit proportionately smaller. European trading did pick up drastically from the start of the year, from 32k trade count and €19 billion notional in the first week to a trade count of 71k and €36 billion in the week of 4 December. Low point was late July and early August.
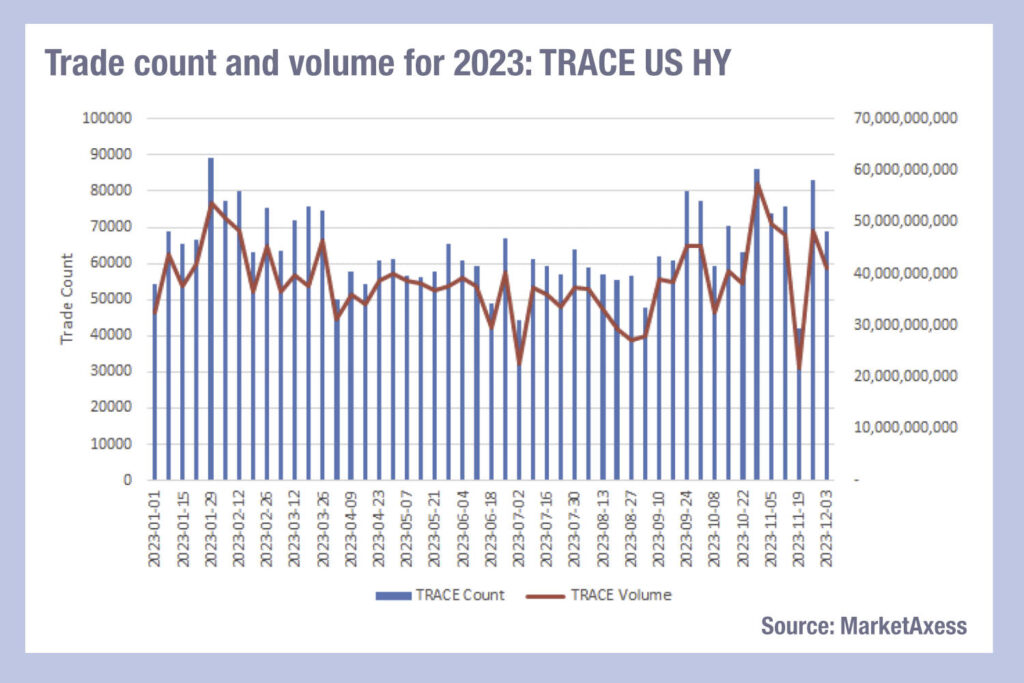 Turning to high yield in US and European markets, the USA saw a flatter profile of notional traded and trade count, suggesting more consistent liquidity provision throughout the year than the European market.
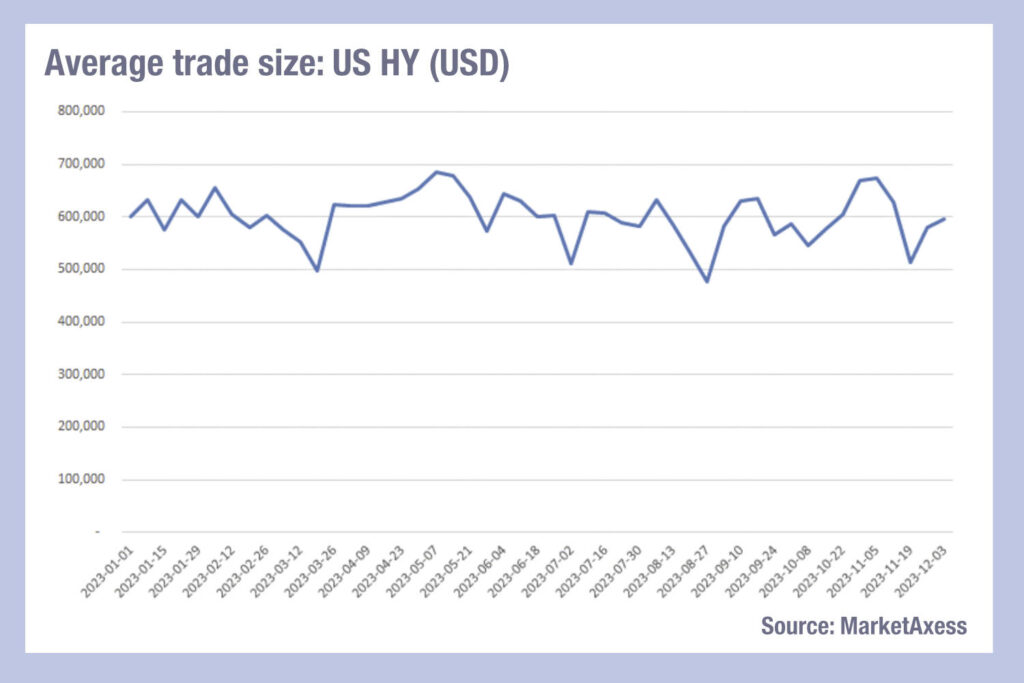
 The year started out with an average trade size of US$599k for the first week of 2023, and finished the year at US$596 for the week of the 4 December.
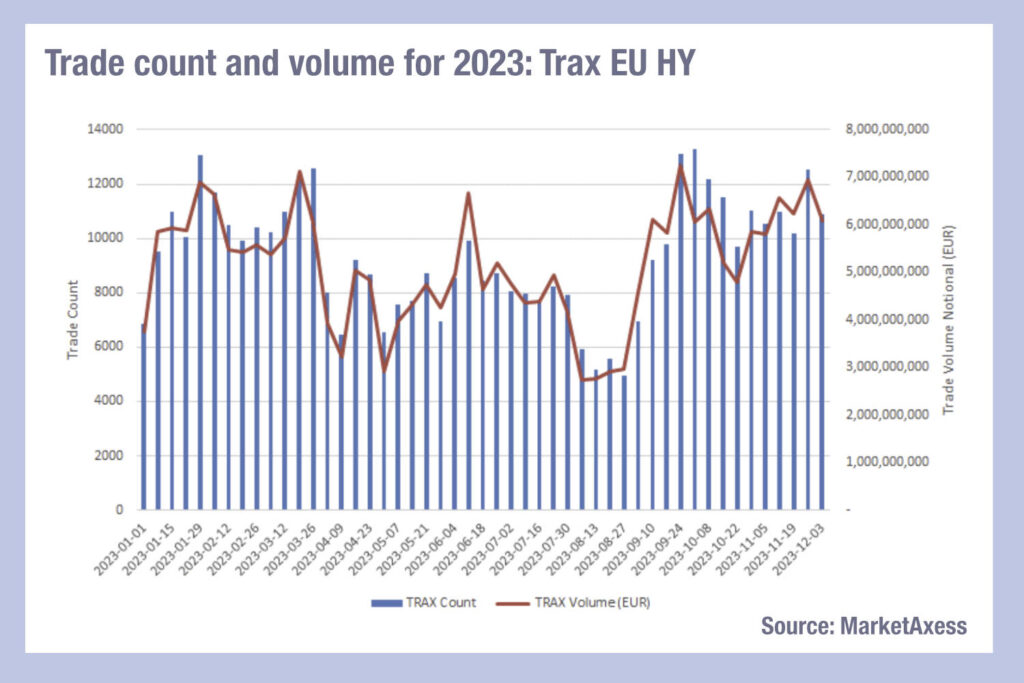
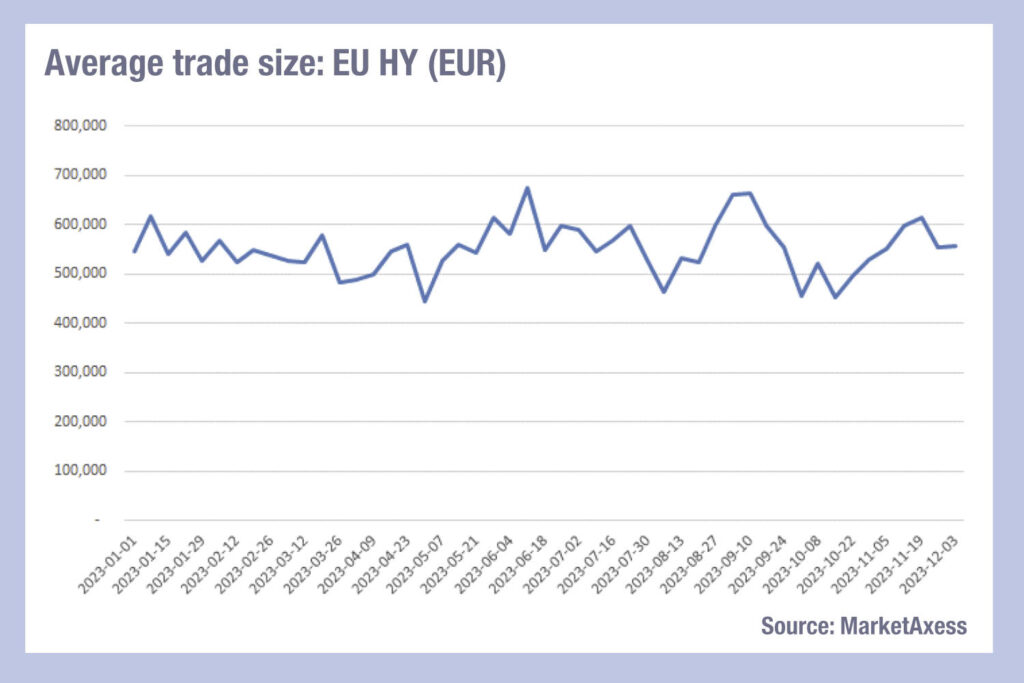
 By contrast European markets saw a slightly increase in the average trade size over that time period, rising from €546k to €557k.
 There were two periods of illiquidity – based on trading activity levels – in Europe, at the start of Q2 and in August, which were also seen to a lesser extent in IG. In both cases we not only see volumes drop, with trade count dropping below 6000 during these periods, but also seeing the trade size decline suggesting it was harder to math larger clips at this point in the year.
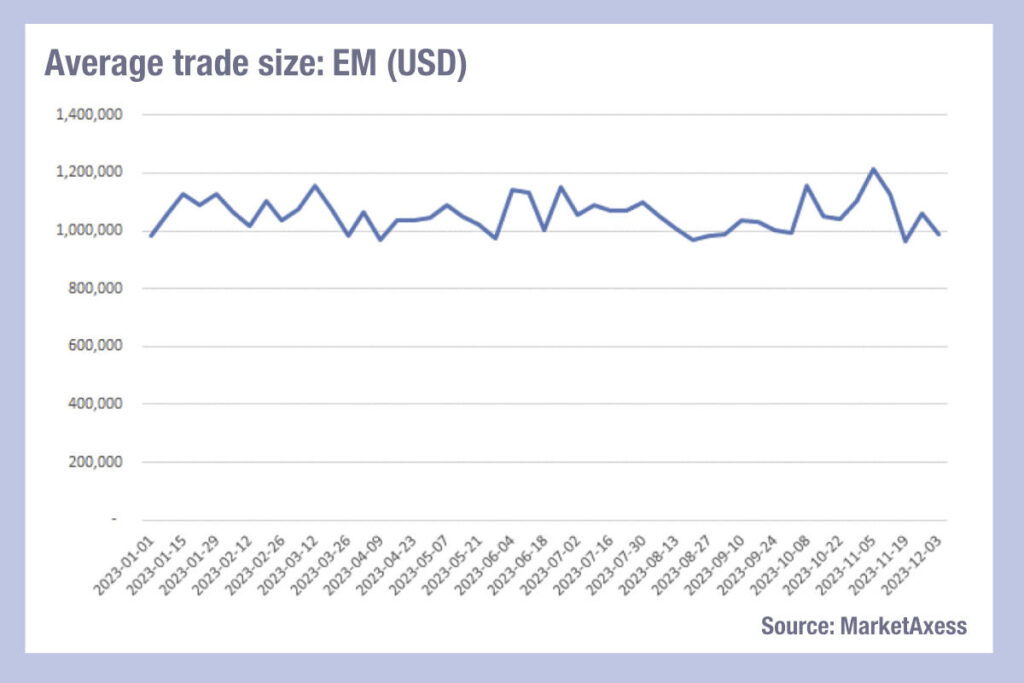
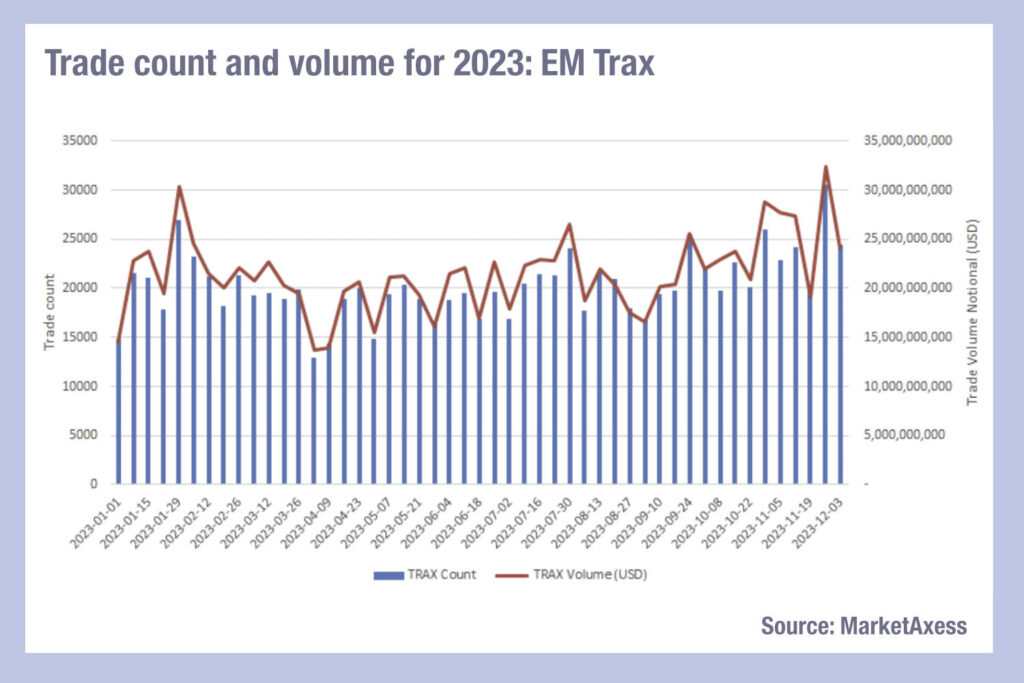 Emerging markets activity has seen very level trade sizes in 2023, rangebound between the USD1-1.2 million mark. Trade count and volume rose gradually over the year, from 15k / US$15 billion in week one to 24k and US$24 billion in the last week we track, 4 December 2023.
 With a top notional weekly traded of US$32 billion and a low of just under US$18 billion, liquidity was certainly highly variable at times, making access and cost of trading hard to pin down without decent pre-trade data sources.
©Markets Media Europe 2023
©Markets Media Europe 2025


 more valuable")


 more valuable")


